How Geopolitical Risk Is Measured: Indices, Methods and Early-Warning Signals
RAGE Global · Guide · Updated 2026-10-21 · 16 min read
Geopolitical risk is one of the most cited and least precisely defined forces in global markets, defense planning and foreign policy. Analysts, central banks and insurers now rely on a family of quantitative tools, from newspaper-based indices to event datasets and composite rankings, to turn wars, threats and state fragility into numbers that can be tracked over time. This guide explains how those tools work, what each one actually measures, and where their limits lie.
Key takeaways
- Geopolitical risk is usually measured in three ways: by counting media attention to threats (the Caldara–Iacoviello GPR index), by recording violent events (ACLED, UCDP), and by combining many indicators into composite scores (Global Peace Index, Fragile States Index).
- UCDP recorded 65 state-based armed conflicts in 2025, the highest number since its records begin in 1946, including 8 interstate conflicts.
- The 2026 Global Peace Index found global peacefulness at its lowest level since the index began, with 99 countries deteriorating over the past year.
- Composite indices depend on choices about indicators, weights and normalization, and those choices shape the results as much as the underlying data.
- Early warning works best when quantitative indices are combined with qualitative indicators and analyst judgment rather than treated as forecasts.
What geopolitical risk means#
A working definition#
The most widely used academic definition comes from Federal Reserve economists Dario Caldara and Matteo Iacoviello, who describe geopolitical risk as the risk associated with wars, terrorist acts and tensions between states that affect the normal and peaceful course of international relations. The definition is deliberately broad. It covers both realized events, such as the outbreak of a war, and the threat of events that may never happen, such as a military buildup or nuclear brinkmanship. That distinction between threats and acts runs through almost every serious attempt to measure the subject.
Why measurement matters#
Without measurement, geopolitical risk remains a rhetorical label attached to whatever is in the headlines. Investors need to know whether a spike in tension is large by historical standards. Humanitarian agencies need to know where violence against civilians is spreading. Defense planners need a baseline to judge whether a region is becoming more volatile. Quantitative indices give each of these users a common reference point, a way to compare periods and places, and a disciplined check on intuition.
Three families of measurement#
Broadly, the field has converged on three approaches. Text-based indices measure how much attention credible media pay to geopolitical threats and events. Event datasets record individual incidents of political violence, with dates, locations, actors and fatalities. Composite indices combine many indicators, often mixing event data with socioeconomic statistics and expert assessments, into a single score or ranking. Each family answers a different question, and the most robust analysis uses more than one.
| Measure | Producer | Method | Coverage | Update frequency |
|---|---|---|---|---|
| Geopolitical Risk (GPR) Index | Caldara and Iacoviello (Federal Reserve Board) | Share of newspaper articles mentioning adverse geopolitical events | Global index from 1985; historical index from 1900; 44 country indices | Monthly, with daily recent data |
| ACLED Conflict Index | Armed Conflict Location and Event Data (ACLED) | Event data scored on deadliness, danger, diffusion and fragmentation | All countries and territories; top 50 ranked | Periodic editions (latest covers Dec 2024 to Nov 2025) |
| UCDP datasets | Uppsala Conflict Data Program, Uppsala University | Coded conflict events with a 25 battle-related deaths threshold | Global, from 1946 | Annual, plus candidate monthly data |
| Global Peace Index | Institute for Economics and Peace | 23 indicators across three domains | 163 countries and territories | Annual (2026 edition released June 2026) |
| Fragile States Index | The Fund for Peace | 12 indicators across cohesion, economic, political and social groups | Around 179 countries | Annual |
Table: Leading geopolitical risk and conflict measures. Sources: Caldara and Iacoviello, ACLED, UCDP, IEP, Fund for Peace; 2026.
The Caldara–Iacoviello GPR index#
How the index is built#
The Geopolitical Risk Index, published in the American Economic Review in 2022, counts newspaper articles that discuss adverse geopolitical events and expresses that count as a share of all articles published in the same period. The recent index draws on ten newspapers, including the New York Times, Financial Times, Wall Street Journal, Guardian and Washington Post, and runs from 1985. A historical version based on three newspapers stretches back to 1900, allowing comparisons with the two world wars. The paper normalizes the recent index to 100 over the 1985–2019 period, so a reading of 200 means geopolitical coverage was twice its long-run average.
Threats versus acts#
The search terms fall into eight categories. Five capture threats: war threats, peace threats, military buildups, nuclear threats and terror threats. Three capture acts: the beginning of war, the escalation of war and terror acts. From these the authors build two sub-indices, Geopolitical Threats (GPRT) and Geopolitical Acts (GPRA). The split matters because markets and policymakers often react more to the threat of conflict than to the conflict itself, and threats tend to rise before acts.
What the index tells us#
The historical index spikes at the start of both world wars, the Korean War, the Cuban Missile Crisis and after the September 11 attacks. In the recent index, the largest peaks before 2020 cluster around the 1991 Gulf War, 9/11 and the 2003 invasion of Iraq. The authors also show that higher geopolitical risk has real economic consequences: in their US estimates, a large shock to the index is followed by a decline in fixed investment of about 1.5 percent after roughly a year, and firms more exposed to geopolitical risk cut investment more than their peers. Across countries, a one standard deviation rise in country-specific geopolitical risk is associated with a markedly higher probability of an economic disaster.
The index is updated monthly, with a daily series refreshed weekly, and covers 44 individual countries. Federal Reserve research published in March 2026 has also introduced an AI-GPR index that uses artificial intelligence to score geopolitical risk, reflecting a broader trend toward large language models in text-based risk scoring.

Chart: How the Caldara–Iacoviello Geopolitical Risk Index is constructed. Source: Caldara and Iacoviello, "Measuring Geopolitical Risk", American Economic Review, 2022.
Event datasets: ACLED and UCDP#
UCDP: the long view since 1946#
The Uppsala Conflict Data Program at Uppsala University is the longest-running systematic record of organized violence. It codes state-based conflicts, non-state conflicts and one-sided violence against civilians, and it uses a threshold of 25 battle-related deaths per year to classify an armed conflict, with 1,000 deaths marking a war. Because its definitions have been stable for decades, UCDP is the standard reference for long-term trends.
Its June 2026 release on 2025 data was stark. UCDP recorded 65 state-based conflicts, the highest number since 1946, and 8 interstate conflicts, also a record and up from 2 in 2023. Thirteen conflicts reached the level of war, the most since 1992. Total deaths from organized violence were about 244,600, the second deadliest year since the 1994 Rwandan genocide. According to UCDP, the Russia–Ukraine war accounted for at least 94,700 deaths, about 62 percent of battle-related deaths worldwide, while one-sided violence against civilians rose by more than 400 percent to about 76,500 deaths.
| UCDP indicator, 2025 | Value | Context |
|---|---|---|
| State-based armed conflicts | 65 | Highest since 1946 |
| Interstate conflicts | 8 | Highest since 1946; 2 in 2023 |
| Wars (1,000+ battle deaths) | 13 | Highest since 1992 |
| Deaths from organized violence | about 244,600 | Second highest since 1994 |
| Deaths in Russia–Ukraine war | at least 94,700 | About 62% of battle-related deaths |
| Deaths from one-sided violence | about 76,500 | Up more than 400% year on year |
| Deaths in non-state conflicts | about 14,500 | Lowest since 2013 |
Table: Key UCDP figures for 2025. Source: Uppsala Conflict Data Program, press release of 9 June 2026.
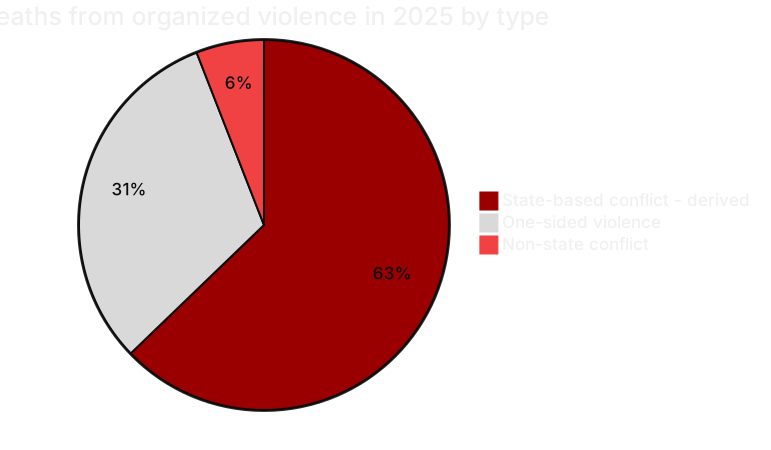
Chart: Approximate distribution of 2025 deaths from organized violence. Source: UCDP, June 2026; the state-based figure is derived by subtracting the published one-sided and non-state totals from the 244,600 total.
ACLED: near-real-time event data#
The Armed Conflict Location and Event Data project (ACLED) collects disaggregated data on political violence and protest worldwide, coding each event by date, location, actors and reported fatalities. Its speed and granularity make it a staple for operational analysts tracking a crisis week by week. ACLED also includes demonstrations and strategic developments, which helps analysts see unrest before it turns violent.
ACLED's Conflict Index converts that event data into a ranking. Every country and territory is scored on four indicators: deadliness (how fatal the violence is), danger (violence targeting civilians), diffusion (how much of the territory sees high levels of violence) and fragmentation (the number of armed groups). The edition covering 1 December 2024 to 28 November 2025 described Palestine, Mexico and Ukraine as among the most dangerous places in the world and found Myanmar the most fragmented, with more than 1,200 distinct armed groups. Brazil, Ecuador, Haiti and Mexico all ranked in the top ten, a reminder that criminal and gang violence can rival interstate war in severity.
Why the two datasets differ#
ACLED and UCDP often report different numbers for the same conflict, and that is a feature of their design rather than an error. They use different source pools, inclusion rules and fatality coding conventions. UCDP prioritizes consistency and verification for long-run research, while ACLED prioritizes coverage and speed. Serious analysts note which dataset a figure comes from and avoid mixing them in a single time series.
Composite rankings: the Global Peace Index and Fragile States Index#
The Global Peace Index#
The Global Peace Index (GPI), produced by the Institute for Economics and Peace (IEP), ranks 163 countries and territories covering about 99.7 percent of the world's population. It uses 23 qualitative and quantitative indicators grouped into three domains: societal safety and security, ongoing domestic and international conflict, and militarization. The 2026 edition found global peacefulness at its lowest level since the index began, with 99 countries deteriorating over the past year.
Iceland ranked first for the 19th consecutive year, followed by New Zealand, Switzerland, Slovenia and Ireland. Russia ranked last of 163, with Sudan, the Democratic Republic of the Congo, Ukraine, Israel and South Sudan also at the bottom of the table. IEP estimated the global economic impact of violence at 21.81 trillion US dollars in 2025, about 10.5 percent of global GDP, and reported that global military expenditure reached a record of about 2.9 trillion dollars. The report also noted that the number of countries involved in external conflicts rose from 59 in 2008 to 103 in 2026.
The Fragile States Index#
The Fragile States Index (FSI), published by The Fund for Peace, measures pressures on states rather than violence itself. It scores countries on 12 indicators grouped into cohesion (security apparatus, factionalized elites, group grievance), economic (economic decline, uneven development, human flight), political (state legitimacy, public services, human rights and rule of law) and social and cross-cutting factors (demographic pressures, refugees and internally displaced persons, external intervention). Each indicator is scored from 0 to 10, giving a maximum of 120, and higher scores mean greater fragility.
The FSI is useful for geopolitical risk analysis because fragility often precedes conflict. States with weak legitimacy, poor public services and large displaced populations are more vulnerable to shocks, from coups to insurgency.
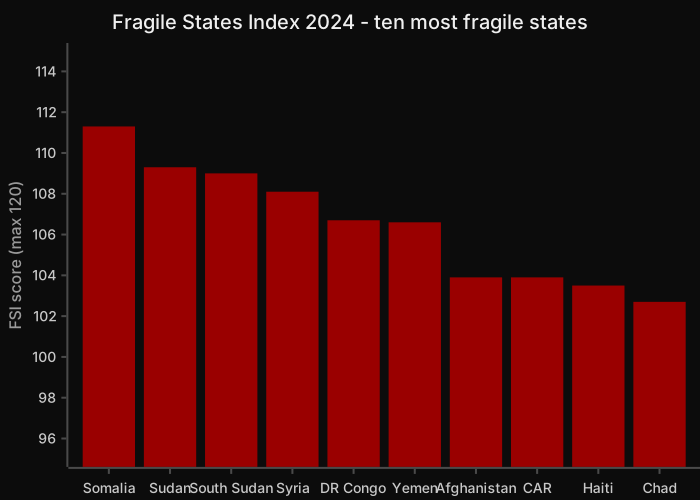
Chart: The ten highest Fragile States Index scores in the 2024 edition. Source: The Fund for Peace, Fragile States Index 2024.
Comparing peace and fragility#
The two rankings overlap but are not identical. Sudan, South Sudan and the Democratic Republic of the Congo appear near the bottom of both. Russia and Israel rank among the least peaceful countries on the GPI because of active wars and militarization, yet neither ranks among the most fragile on the FSI, because their state institutions remain strong. This difference illustrates a core point: geopolitical risk can come from strong states projecting force as well as from weak states collapsing.
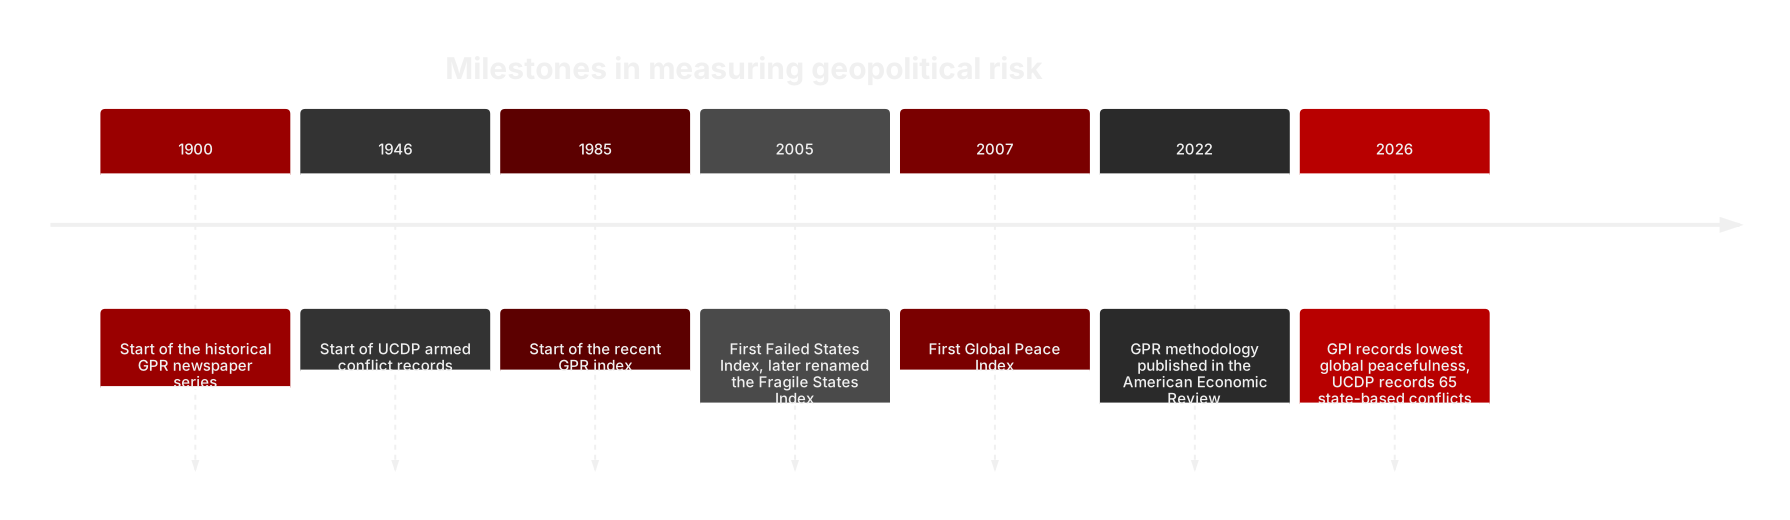
Chart: Key dates in the development of geopolitical risk measures. Sources: Caldara and Iacoviello (2022), UCDP, Fund for Peace, IEP; 2026.
How analysts build a composite geopolitical risk index#
Step 1: define the construct#
Every composite index starts with a question. "How likely is armed conflict in this country next year?" leads to different indicators than "How exposed is a portfolio to geopolitical shocks?" The OECD and European Commission Joint Research Centre handbook on composite indicators, the standard methodological reference, stresses that a clear theoretical framework must come before data selection. Without one, an index becomes a collection of available statistics rather than a measure of anything coherent.
Step 2: select and clean indicators#
Analysts then choose indicators that map onto the framework: conflict fatalities, displacement, military spending, sanctions, election calendars, media sentiment, and so on. Each must be available for the countries and periods being compared. Missing data is handled by imputation, by dropping indicators, or by flagging low-confidence scores. Outliers, such as a single catastrophic event, are often capped or log-transformed so they do not dominate the result.
Step 3: normalize, weight and aggregate#
Because indicators are measured in different units, they are normalized, typically by rescaling to a common range such as 0 to 1 or by converting to standard scores. Weights are then assigned. Some indices use equal weights for transparency; others use expert panels, statistical techniques such as principal component analysis, or weights derived from how well each indicator predicted past conflict. Aggregation can be additive, which lets strength in one area offset weakness in another, or geometric, which penalizes very poor performance on any single dimension.
Step 4: test robustness#
Good practice is to test how rankings change when weights, normalization methods or individual indicators are altered. If a country's rank swings dramatically under reasonable alternative choices, the index is signaling uncertainty, and that uncertainty should be reported alongside the score.
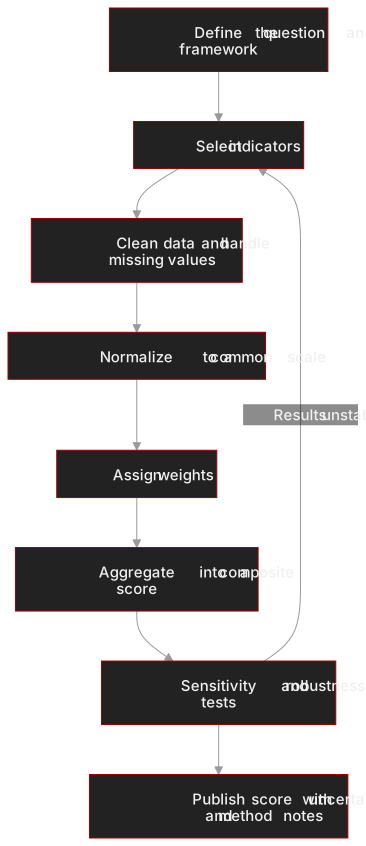
Chart: The standard workflow for building a composite risk index. Source: OECD and JRC, Handbook on Constructing Composite Indicators, 2008.
Live conflict intensity readings#
A newer category of products publishes continuously updated readings of conflict intensity rather than annual rankings. RAGE INDEX — Global Conflict Intelligence is RAGE X's live conflict index, published by RAGE Intel, and it provides a conflict-intensity reading designed for readers who need a current picture between the annual releases of the major datasets. Like any index, a live reading is most useful when read alongside the long-run baselines provided by UCDP, ACLED and the composite rankings described above.
Indicators and warnings: from data to early warning#
The I&W tradition#
Intelligence services have long used an "indicators and warnings" (I&W) method. Analysts list the observable steps an adversary would likely take before an attack or a crisis, such as mobilizing reserves, moving logistics units forward, cancelling leave, stockpiling fuel or shifting official rhetoric, and then monitor for those signs. The method does not predict the future. It structures attention so that analysts notice change early and can tell decision-makers how the picture is shifting.
Common early-warning signals#
Quantitative early-warning systems tend to watch several categories of signal. Political signals include contested elections, coups in neighboring states, the removal of term limits and the exclusion of groups from power. Security signals include troop movements, unusual military exercises and the arrival of foreign forces. Economic signals include currency collapse, food price spikes and sanctions. Social signals include mass protests, hate speech and displacement. Information signals, captured by text-based indices like the GPR, include rising threat language in official statements and media coverage.
Statistical forecasting#
Academic projects such as the Violence Early-Warning System (ViEWS), developed at Uppsala University and the Peace Research Institute Oslo, use UCDP data and machine learning to produce probabilistic monthly forecasts of conflict fatalities. Such systems are strongest at predicting that violence will continue where it already exists and weakest at predicting the outbreak of conflict in previously peaceful places, which is precisely where warning is most valuable.
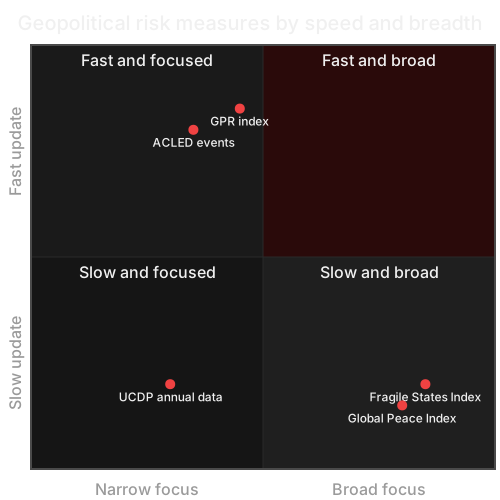
Chart: Approximate positioning of major measures by update frequency and thematic breadth. Source: RAGE X analysis of published methodologies, 2026.
Limitations and common pitfalls#
Media and reporting bias#
Text-based indices measure attention, not reality. English-language newspapers cover some regions far more than others, so a war in Sudan may register less strongly than a diplomatic spat involving a major Western economy. Event datasets face a related problem: violence in remote areas or under information blackouts is underreported, and fatality figures from parties to a conflict can be inflated or suppressed.
Definitions and thresholds#
Thresholds shape the numbers. UCDP's 25-death threshold excludes low-level violence that may still be strategically significant. Definitions of "state-based" versus "non-state" conflict, or of a "civilian" target, require judgment calls that differ between datasets. A rise in the number of conflicts can reflect fragmentation of existing wars into multiple coded dyads rather than new wars breaking out.
Weighting and false precision#
Composite indices compress complex realities into one number, which can create false precision. A country ranked 40th and one ranked 45th may be statistically indistinguishable. Weights embed value judgments: an index that weights militarization heavily will penalize states with large defense budgets even if they are internally stable. Users should read the methodology before the ranking.
Lag and surprise#
Annual indices describe the past year. Even monthly series lag events by weeks. And the most consequential geopolitical shocks, such as surprise attacks, sudden regime collapses or assassinations, are by nature hard to anticipate from structural indicators alone. Indices are best treated as context and as a discipline for analysis, not as forecasts of specific events.
Frequently asked questions#
What is geopolitical risk?#
Geopolitical risk is the risk that wars, terrorism and tensions between states disrupt the normal course of international relations, with consequences for security, economies and markets. The definition used by Caldara and Iacoviello, the most widely cited in academic and financial research, explicitly includes both the threat of adverse events and their realization. In practice, analysts also consider related drivers such as sanctions, coups and state fragility. Because the concept is broad, it is usually measured with several complementary tools rather than a single number.
What is the GPR index?#
The GPR index is the Geopolitical Risk Index created by Federal Reserve economists Dario Caldara and Matteo Iacoviello and published in the American Economic Review in 2022. It measures the share of articles in ten major newspapers that mention adverse geopolitical events and threats. The recent index starts in 1985 and is normalized to 100 over 1985–2019, while a historical version reaches back to 1900. It is updated monthly, includes 44 country-specific indices, and splits into threat and act sub-indices.
What is the difference between ACLED and UCDP?#
Both record political violence, but they serve different purposes. UCDP, run by Uppsala University, has coded armed conflict since 1946 using stable definitions and a 25 battle-related deaths threshold, making it the reference for long-term trends. ACLED collects detailed, near-real-time event data on political violence and protest, which suits operational monitoring. Because their sourcing and coding rules differ, their figures for the same conflict can diverge, so analysts should not combine them in a single time series.
Which country is the most peaceful in 2026?#
According to the 2026 Global Peace Index from the Institute for Economics and Peace, Iceland is the most peaceful country, a position it has held for 19 consecutive years. New Zealand, Switzerland, Slovenia and Ireland complete the top five. At the other end, Russia ranked last of 163 countries and territories. The index uses 23 indicators across societal safety and security, ongoing conflict and militarization, so rankings reflect both internal conditions and external military activity.
Can geopolitical risk be predicted?#
Geopolitical risk can be anticipated in part, but not predicted with precision. Statistical systems are good at forecasting that violence will persist where it already exists, and indicators-and-warnings methods help analysts spot preparations for crises. However, sudden shocks such as surprise attacks or leadership collapses remain difficult to forecast. The most reliable approach combines quantitative indices, monitoring of specific warning indicators and experienced analytical judgment, with forecasts expressed as probabilities rather than certainties.
How do investors use geopolitical risk indices?#
Investors use indices such as the GPR to gauge whether current tensions are high by historical standards, to stress-test portfolios against past shocks, and to study how assets such as oil, gold, defense equities and emerging-market currencies have reacted to earlier spikes. Research by Caldara and Iacoviello links higher geopolitical risk to lower investment and higher disaster probabilities. Investors typically pair these indices with country-level conflict data and political analysis before making allocation decisions.
The RAGE X view#
The measurement of geopolitical risk has matured from anecdote into a credible discipline, but no single index captures the whole picture. The GPR index captures how threatening the world appears to major media; ACLED and UCDP capture what violence actually occurs; the Global Peace Index and Fragile States Index capture the structural conditions that make violence more or less likely. The 2025 data point in one direction across all three families: more state-based conflicts, more interstate wars and less peace than at any point in the modern record.
For decision-makers, the lesson is methodological discipline. Use several measures, understand how each is built, report uncertainty, and treat indices as tools for asking better questions rather than as answers. RAGE X follows these developments through RAGE Intel coverage and the live conflict-intensity reading published as RAGE INDEX, and will continue to read every number against the long-run baselines that give it meaning.
Sources#
- Caldara, D. and Iacoviello, M. "Measuring Geopolitical Risk." American Economic Review, 2022. https://www.aeaweb.org/doi/10.1257/aer.20191823
- Iacoviello, M. Geopolitical Risk (GPR) Index: Overview and Data. https://matteoiacoviello.com/gpr.htm
- Caldara, D. and Iacoviello, M. "Measuring Geopolitical Risk" working paper (PDF). https://www.matteoiacoviello.com/gpr_files/GPR_PAPER.pdf
- Uppsala University. "UCDP: Record number of conflicts between states." 9 June 2026. https://www.uu.se/en/news/2026/2026-06-09-ucdp-record-number-of-conflicts-between-states
- ACLED. Conflict Index: Ranking violent conflict levels across the world. https://acleddata.com/acled-conflict-index
- ACLED. About the Conflict Index. https://acleddata.com/general-guide/about-conflict-index
- Institute for Economics and Peace. Global Peace Index 2026 Report. https://www.visionofhumanity.org/wp-content/uploads/2026/06/Global-Peace-Index-2026-Report.pdf
- Institute for Economics and Peace. What is the Global Peace Index? https://www.visionofhumanity.org/global-peace-index
- The Fund for Peace. Fragile States Index. https://fragilestatesindex.org
- OECD and European Commission JRC. Handbook on Constructing Composite Indicators: Methodology and User Guide, 2008. https://www.oecd.org/sdd/42495745.pdf
- Federal Reserve Bank of San Francisco research listing. "The AI-GPR Index: Measuring Geopolitical Risk using Artificial Intelligence." March 2026. https://www.frbsf.org/research-and-insights/publications/board-of-governors/2026/03/the-ai-gpr-index-measuring-geopolitical-risk-using-artificial-intelligence/
- Violence and Impacts Early-Warning System (VIEWS), Uppsala University and PRIO. https://viewsforecasting.org
About RAGE X: RAGE X is a global media, intelligence and technology organization working across geopolitical intelligence, military and conflict analysis, OSINT, global news, security and software. Learn more at theragex.com.
Continue the assessment
Related Intelligence
Beirut Port, Six Years On: A Thousand-Page File and Zero Indictments
Six years after the Beirut port blast: 220+ dead, 70 defendants, a 1,000-page file referred in March 2026 — and still no indictment issued.
2026-08-04 · 14 min read
What Is OSINT? The Complete Guide to Open-Source Intelligence
What is OSINT? A complete guide to open-source intelligence: definition, history, intelligence cycle, core techniques, ethics, case studies and careers.
2026-10-21 · 17 min read
Global Military Spending 2026: Who Spends the Most and Why
Global military spending hit $2,887 billion in 2025, per SIPRI. See the top 15 spenders, regional trends, share of GDP, NATO's 5% target and the outlook.
2026-10-21 · 15 min read
Today's conflict risk
The daily RAGE INDEX scores global conflict risk across six theaters, with sources and forecasts.
Read the RAGE INDEXReach readers like these
RAGE X sells sponsored content across RAGE Intel, RAGE War and RAGE Global by proposal, always labelled as sponsored.
Request a campaign proposal