Global Military Spending 2026: Who Spends the Most and Why
RAGE Global · Guide · Updated 2026-10-21 · 15 min read
Global military spending reached $2,887 billion in 2025, according to the Stockholm International Peace Research Institute (SIPRI), whose annual data released on 27 April 2026 is the most widely used benchmark for world defense expenditure. The total was 2.9 percent higher in real terms than in 2024, marking the eleventh consecutive year of growth. This analysis breaks down who spends the most, how the regional picture is shifting, what share of their economies states devote to defense, and what is likely to drive budgets through the rest of the decade.
Key takeaways
- World military expenditure was $2,887 billion in 2025, up 2.9 percent in real terms and 41 percent higher than in 2016, according to SIPRI.
- The United States remained the largest spender at $954 billion, but its spending fell 7.5 percent, mainly due to a sharp reduction in overseas military aid. China ($336 billion, estimated) and Russia ($190 billion, estimated) followed.
- Europe rose 14 percent to $864 billion, driven by Germany, Poland, Spain and Italy; European NATO members increased spending faster than at any time since 1953, according to SIPRI.
- The global military burden rose to 2.5 percent of world GDP. Ukraine spent an estimated 40 percent of GDP, the highest in the world.
- NATO's 2025 Hague commitment to spend 5 percent of GDP on defense and security by 2035 points to further growth, as does a $1.5 trillion US defense request for fiscal 2027.
Global military spending in 2025: the headline numbers#
An eleventh consecutive year of growth#
SIPRI's April 2026 release covers calendar year 2025 and puts world military expenditure at $2,887 billion in current US dollars. In real terms, adjusted for inflation, that represents an increase of 2.9 percent over 2024 and a cumulative rise of 41 percent since 2016. The pace slowed markedly from 2024, when SIPRI now estimates global spending grew by 9.7 percent, the steepest annual rise since at least the end of the Cold War.
The slowdown is almost entirely a US story. Excluding the United States, spending by the rest of the world continued to grow strongly, led by Europe and Asia. "Global military spending rose again in 2025 as states responded to another year of wars," said SIPRI researcher Xiao Liang in the institute's press release, pointing to the war in Ukraine, conflict in the Middle East and rising tension in East Asia.
Burden, per capita and concentration#
The world military burden, meaning military expenditure as a share of global gross domestic product, rose to 2.5 percent in 2025 from 2.4 percent in 2024. Spending per person worldwide was $352. Military spending accounted for 6.9 percent of total government expenditure, slightly down from 7.0 percent a year earlier.
Spending remains heavily concentrated. The five largest spenders together accounted for $1,686 billion, or 58 percent of the world total, and the top 15 spent $2,304 billion, or 80 percent. That concentration means that budget decisions in a handful of capitals, above all Washington and Beijing, shape the global trend more than any other factor.
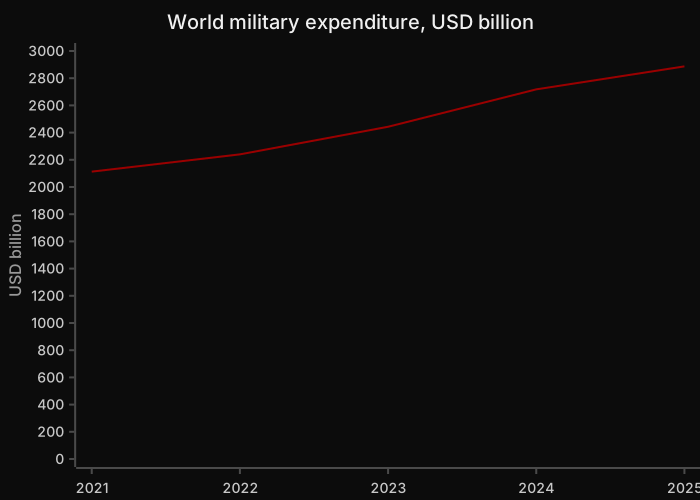
Chart: world military expenditure as first reported in each annual SIPRI release, current US dollars. Source: SIPRI Military Expenditure Database releases 2022 to 2026.
The top 15 military spenders#
The 2025 ranking#
The ranking at the top of the table is stable: the United States, China and Russia occupy the first three places, as they have for several years. Below them, the most notable change is Germany's rise to fourth place, ahead of India, after its spending grew by 24 percent to $114 billion. Ukraine ranked seventh, and Poland and Spain both climbed on the back of very rapid growth.
| Rank | Country | Spending 2025 (USD bn) | Real change 2024–25 | Share of GDP | Share of world total |
|---|---|---|---|---|---|
| 1 | United States | 954 | -7.5% | 3.1% | 33% |
| 2 | China* | 336 | +7.4% | 1.7% | 12% |
| 3 | Russia* | 190 | +5.9% | 7.5% | 6.6% |
| 4 | Germany | 114 | +24% | 2.3% | 3.9% |
| 5 | India | 92.1 | +8.9% | 2.3% | 3.2% |
| 6 | United Kingdom | 89.0 | -2.0% | 2.4% | 3.1% |
| 7 | Ukraine* | 84.1 | +20% | 40% | 2.9% |
| 8 | Saudi Arabia* | 83.2 | +1.4% | 6.5% | 2.9% |
| 9 | France | 68.0 | +1.5% | 2.0% | 2.4% |
| 10 | Japan | 62.2 | +9.7% | 1.4% | 2.2% |
| 11 | Israel | 48.3 | -4.9% | 7.8% | 1.7% |
| 12 | Italy | 48.1 | +20% | 1.9% | 1.7% |
| 13 | South Korea | 47.8 | +2.6% | 2.6% | 1.7% |
| 14 | Poland | 46.8 | +23% | 4.5% | 1.6% |
| 15 | Spain | 40.2 | +50% | 2.1% | 1.4% |
Table: the 15 largest military spenders in 2025. An asterisk marks SIPRI estimates. Source: SIPRI Fact Sheet, "Trends in World Military Expenditure, 2025" (April 2026).
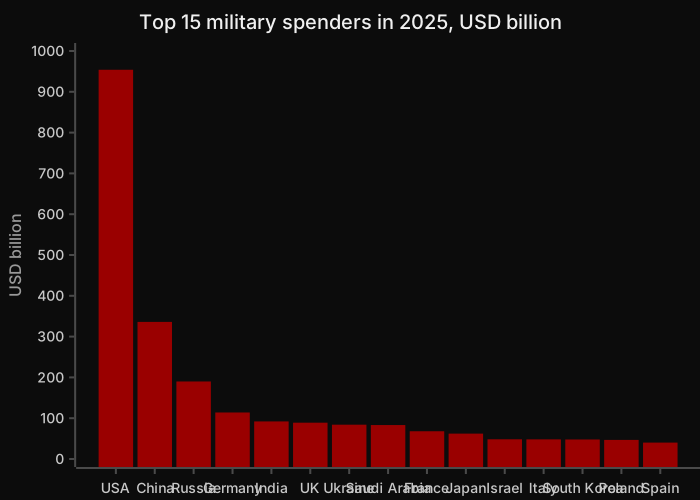
Chart: the 15 largest military spenders, 2025. Source: SIPRI Military Expenditure Database (April 2026).
The United States: a dip, not a turn#
US military expenditure fell 7.5 percent to $954 billion in 2025. SIPRI attributes the decline mainly to a sharp reduction in financial military assistance overseas, the category that had carried large packages of aid to Ukraine in previous years, rather than to cuts in the core Pentagon budget. Even after the fall, the United States spent 2.8 times as much as China, down from 3.2 times in 2024, and accounted for a third of the world total. SIPRI's programme director Nan Tian said the decline "is likely to be short-lived", citing planned budget growth.
China and Russia: steady and wartime growth#
China's estimated spending rose 7.4 percent to $336 billion, its largest annual increase in a decade and its 31st consecutive year of growth, the longest uninterrupted run in SIPRI's database. Its military burden, at an estimated 1.7 percent of GDP, remains modest compared with Russia's, reflecting the scale of China's economy. Russia's spending grew 5.9 percent to an estimated $190 billion, equal to 7.5 percent of GDP and 20 percent of total government spending, the highest share SIPRI has recorded for Russia. SIPRI marks the Russian figure as an estimate, reflecting limited budget transparency.
Ukraine's extraordinary burden#
Ukraine's military expenditure rose 20 percent to an estimated $84.1 billion, which SIPRI calculates as 40 percent of GDP and 63 percent of government spending, by far the highest burden in the world. Ukraine's spending has risen by 1,501 percent since 2016. SIPRI also notes that Ukraine received $52.2 billion in support from partners to finance its state budget, which allows Kyiv to devote domestic revenue to defense. "Their spending is likely to keep growing in 2026 if the war continues," SIPRI researcher Lorenzo Scarazzato said of the two belligerents.
Regional trends#
Europe overtakes the Cold War trajectory#
Europe was the fastest-growing region in 2025, with spending up 14 percent to $864 billion, more than double its 2016 level. The 29 European NATO members spent $559 billion. "In 2025 military spending by European NATO members rose faster than at any time since 1953," said SIPRI researcher Jade Guiberteau Ricard. Germany crossed 2 percent of GDP for the first time since 1990 and has pledged to reach 3.5 percent by 2029. Spain's spending rose 50 percent, lifting its burden above 2 percent of GDP for the first time since NATO's 2014 target was agreed, and Italy's grew 20 percent. Poland spent 4.5 percent of GDP, the highest burden in NATO, followed by Latvia at 3.6 percent.
The Americas, Asia, the Middle East and Africa#
Spending in the Americas fell 6.6 percent to $1,065 billion, reflecting the US decline; Canada was a notable exception, with spending up 23 percent to $37.5 billion, while Mexico's fell by about a third to $13.6 billion. Asia and Oceania rose 8.1 percent to $681 billion, with East Asia alone accounting for $464 billion. Japan's spending grew 9.7 percent to $62.2 billion, its highest burden since 1958, and Taiwan's rose 14 percent to $18.2 billion, its largest increase since at least 1988. India spent $92.1 billion and Pakistan $11.9 billion, the latter up 11 percent in a year that included a brief military confrontation between the two in May 2025.
The Middle East was broadly flat at an estimated $218 billion, up just 0.1 percent. Saudi Arabia remained the largest regional spender at an estimated $83.2 billion, Israel's spending fell 4.9 percent to $48.3 billion after its wartime surge, Türkiye's rose 7.2 percent to $30.0 billion, and Iran's fell for the second consecutive year to $7.4 billion. Africa's spending grew 8.5 percent to $58.2 billion; Algeria remained the continent's largest spender and, at 8.8 percent of GDP, had the second-highest military burden in the world.
| Region | Spending 2025 (USD bn) | Real change 2024–25 | Real change 2016–25 | Share of world |
|---|---|---|---|---|
| Americas | 1,065 | -6.6% | +13% | 37% |
| Europe | 864 | +14% | +102% | 30% |
| Asia and Oceania | 681 | +8.1% | +48% | 24% |
| Middle East* | 218 | +0.1% | +36% | 7.6% |
| Africa | 58.2 | +8.5% | +45% | 2.0% |
Table: military expenditure by region, 2025. Middle East figure is a SIPRI estimate. Source: SIPRI Fact Sheet (April 2026).
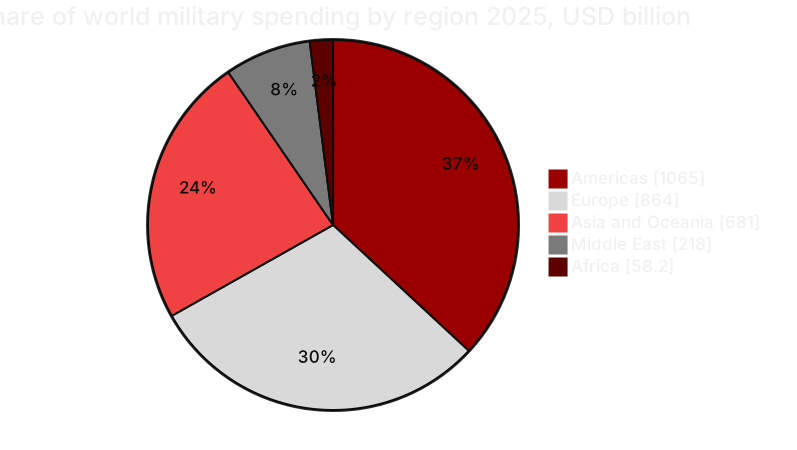
Chart: regional shares of global military spending, 2025. Source: SIPRI Military Expenditure Database (April 2026).
Military spending as a share of GDP#
Why the burden matters#
Absolute dollar totals measure capacity; the military burden, or spending as a share of GDP, measures effort and economic strain. The two rankings look very different. The United States spends by far the most in dollars but devotes a smaller share of its economy to defense than Russia, Israel or Poland. China ranks second in dollars yet has one of the lower burdens among major powers. States at war or under acute threat stand out: Ukraine at 40 percent, Algeria at 8.8 percent, Israel at 7.8 percent and Russia at 7.5 percent.
Regionally, SIPRI calculates that the Middle East has the highest average burden at 3.8 percent of GDP, followed by Europe at 3.2 percent, Africa at 1.8 percent, Asia and Oceania at 1.6 percent and the Americas at 1.2 percent. Europe's average has risen sharply as states respond to Russia's war against Ukraine and to pressure from Washington to carry more of the alliance burden.
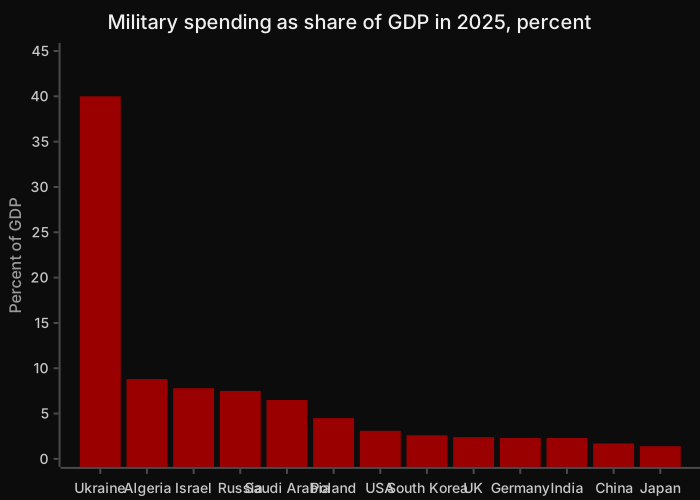
Chart: military burden of selected countries, 2025. Ukraine, Russia, Saudi Arabia and China are SIPRI estimates. Source: SIPRI (April 2026).
The limits of the measure#
A high burden can reflect a large military effort, a small economy, or both. Ukraine's 40 percent partly reflects a war-damaged economy, while Algeria's high share reflects both sustained procurement and the size of its GDP. Burden also says nothing about efficiency: two states spending the same share of GDP can field very different capabilities depending on personnel costs, procurement choices and domestic industry. Analysts therefore read burden figures alongside absolute spending, equipment share and the composition of budgets.
NATO: from 2 percent to 5 percent#
The 2014 Wales pledge#
At the 2014 Wales summit, after Russia's annexation of Crimea, NATO allies pledged to move toward spending 2 percent of GDP on defense within a decade. Progress was slow at first. According to CSIS analysis of NATO data, only 3 of 27 allies met the threshold in 2014 and 7 of 29 in 2022. Russia's full-scale invasion of Ukraine changed that trajectory sharply. NATO's own estimates indicate that all 31 allies with armed forces reached 2 percent in 2025.
SIPRI's methodology produces a slightly different picture: by its count, 23 of the 32 NATO members spent at least 2.0 percent of GDP in 2025. The difference arises because NATO's definition of defense expenditure includes items such as certain pensions, some paramilitary forces and aid to Ukraine that SIPRI may treat differently. The 32 NATO members together spent $1,581 billion, or 55 percent of the world total, by SIPRI's measure.
The 2025 Hague commitment#
At their June 2025 summit in The Hague, allies agreed to a new target of 5 percent of GDP by 2035, split into two parts: at least 3.5 percent for core defense, measured under NATO's agreed definition, and up to 1.5 percent for broader defense- and security-related spending such as critical infrastructure, civil resilience and the defense industrial base. Allies must submit annual plans showing a credible path to the target, and the trajectory will be reviewed in 2029. Spain said it secured flexibility on the target; CSIS describes the arrangement as an exemption.
According to CSIS, only Poland, Lithuania and Latvia were estimated to meet the 3.5 percent core level in 2025. NATO's overall spending rose an estimated 23 percent in real terms between 2022 and 2025, and that of European allies and Canada by 54 percent. The composition of budgets has also changed: equipment accounted for about 32 percent of allied defense budgets on average in 2025, up from 13 percent in 2014, while the personnel share fell from almost 60 percent to 35 percent. Allies reviewed progress at the July 2026 summit in Ankara.
| NATO milestone | Year | Target | Status |
|---|---|---|---|
| Wales summit | 2014 | Move toward 2% of GDP within a decade | 3 of 27 allies at 2% in 2014 (CSIS) |
| Post-invasion surge | 2022 | 2% as a floor | 7 of 29 allies at 2% in 2022 (CSIS) |
| NATO estimates | 2025 | 2% | All 31 allies with armed forces at 2% (NATO estimate); 23 of 32 by SIPRI methodology |
| The Hague summit | 2025 | 5% by 2035 (3.5% core plus 1.5% related) | 3 allies at 3.5% core in 2025 (CSIS) |
Table: NATO spending targets and compliance. Sources: CSIS (July 2026); SIPRI (April 2026).
What is driving the rise#
War and the threat environment#
The most direct driver is war. Russia's invasion of Ukraine has transformed European threat perceptions, prompting rapid rearmament across the continent, especially among frontline states on NATO's eastern flank. The conflict has also exposed shortfalls in ammunition stocks, air defense and industrial capacity, pushing procurement up as a share of budgets. In the Middle East, conflict involving Israel, Iran and non-state armed groups has kept regional budgets high, even as some fell from their 2024 peaks.
In Asia, SIPRI points to tension over Taiwan, the South China Sea and the Korean Peninsula. "US allies in Asia and Oceania such as Australia, Japan and the Philippines are spending more on their militaries," said SIPRI senior researcher Diego Lopes da Silva. China's sustained increases and modernization, including naval expansion and nuclear forces growth reported by the US Department of Defense, feed a regional dynamic in which neighbors respond to one another.
Alliance politics, industry and technology#
Alliance politics is a second driver. US pressure on European allies to carry more of the defense burden, made explicit in the Hague commitment, has accelerated budget decisions in capitals that had resisted for years. A third driver is industrial: governments are spending to expand munitions production, rebuild stockpiles and reduce dependence on foreign suppliers, with Europe in particular investing in its own defense industrial base.
Technology adds further pressure. Drones, long-range precision strike, missile defense, space systems and cyber capabilities are absorbing growing shares of procurement and research budgets. The war in Ukraine has demonstrated how quickly battlefield technology evolves, encouraging states to invest both in high-end platforms and in cheaper, mass-produced systems that can be replaced rapidly.
How military spending is measured#
SIPRI's definition#
SIPRI's figures include all current and capital expenditure on armed forces, including peacekeeping forces; defense ministries and other government agencies engaged in defense projects; paramilitary forces when judged to be trained and equipped for military operations; and military space activities. They cover personnel costs, including pensions, operations and maintenance, procurement, military research and development, and military aid. Because the definition is applied consistently across countries, SIPRI data allows comparisons that national budget documents alone do not.
Estimates, currencies and comparability#
Several important caveats apply. Figures for China, Russia, Saudi Arabia, Ukraine and the Middle East as a whole are SIPRI estimates, reflecting limited transparency. Dollar figures are converted at market exchange rates, which tends to understate the purchasing power of budgets in countries with lower costs; some analysts prefer purchasing power parity comparisons, which would raise estimates for China, Russia and India. Real growth rates are calculated in constant prices, which is why a country's percentage change may not match the difference between two current-dollar figures. Finally, NATO, IISS and national governments each use different definitions, so readers should compare like with like.
Outlook for 2026 and beyond#
The United States and Europe#
The signals point to further growth. In April 2026, the White House requested $1.5 trillion for defense in fiscal year 2027, according to Axios and other outlets, an amount that relies on hundreds of billions of dollars in budget reconciliation legislation and includes $17.5 billion for the Golden Dome missile defense program. Congress will determine the final figure, but even a substantially smaller appropriation would reverse the 2025 decline that SIPRI recorded.
In Europe, the Hague commitment creates a decade-long upward path. Germany's plan to reach 3.5 percent of GDP by 2029 alone implies continued double-digit increases, and frontline states such as Poland and the Baltic countries already exceed the core target. Fiscal constraints remain a limiting factor: several large European economies face high debt and competing demands for social spending, which will test whether pledges translate into appropriations.
Asia, the Middle East and risks to the forecast#
In Asia, Japan, South Korea, Taiwan, Australia and India are all increasing budgets, and China shows no sign of breaking its three-decade growth streak. In the Middle East, spending will depend heavily on the trajectory of regional conflicts and on oil revenues for Gulf states. The main uncertainties for the global forecast are the course of the war in Ukraine, the state of US-China relations, economic growth and inflation, and political change in major capitals. A ceasefire in Ukraine would not necessarily reduce European budgets, which are now anchored to long-term capability targets.
Frequently asked questions#
What is global military spending in 2026?#
The most recent comprehensive data, published by SIPRI in April 2026, covers 2025 and puts global military spending at $2,887 billion. That was 2.9 percent higher in real terms than in 2024 and the eleventh consecutive annual increase. SIPRI's figures for 2026 will be released in spring 2027. Indicators such as the US fiscal 2027 budget request, Germany's spending plans and NATO's Hague commitment suggest that world spending will continue to rise, but final numbers depend on budgets that are still being legislated.
Which country spends the most on its military?#
The United States, by a wide margin. SIPRI estimates US military expenditure at $954 billion in 2025, about 33 percent of the world total and roughly 2.8 times China's estimated $336 billion. US spending fell 7.5 percent in 2025, mainly because of lower overseas military aid, but it remained almost three times larger than any other country. China, Russia, Germany and India completed the top five, followed by the United Kingdom, Ukraine, Saudi Arabia, France and Japan.
Which country spends the highest share of GDP on its military?#
Ukraine, at an estimated 40 percent of GDP in 2025, according to SIPRI, reflecting the demands of its war with Russia. Algeria had the second-highest burden at 8.8 percent, followed by Israel at 7.8 percent and Russia at 7.5 percent. Among NATO members, Poland had the highest burden at 4.5 percent. For comparison, the world average was 2.5 percent of GDP, the United States spent 3.1 percent and China an estimated 1.7 percent.
What is NATO's 5 percent target?#
At The Hague summit in June 2025, NATO allies committed to spend 5 percent of GDP on defense and security by 2035. At least 3.5 percent must go to core defense as defined by NATO, while up to 1.5 percent can cover related areas such as critical infrastructure, civil resilience and the defense industrial base. Allies submit annual plans, and progress will be reviewed in 2029. According to CSIS, only Poland, Lithuania and Latvia met the 3.5 percent core level in 2025.
Why is global military spending rising?#
The main drivers are war and threat perception. Russia's invasion of Ukraine prompted rapid European rearmament, conflict in the Middle East kept regional budgets high, and tensions in East Asia pushed Japan, Taiwan and others to spend more. Alliance politics, especially US pressure on European allies, has accelerated budget decisions. States are also investing to rebuild ammunition stocks, expand defense industry and acquire new technologies such as drones, missile defense and space systems.
Where does military spending data come from?#
The most widely cited source is the SIPRI Military Expenditure Database, which applies a consistent definition to most of the world's states and publishes annual figures each April. Other sources include NATO's annual defense expenditure reports for its members, the International Institute for Strategic Studies' Military Balance, and national budget documents. Each uses different definitions, so totals differ. SIPRI's figures for countries with limited transparency, including China and Russia, are estimates.
The RAGE X view#
The 2025 data shows a world in which the trend in military spending is set less by any single budget than by an accumulation of security pressures: a protracted war in Europe, persistent conflict in the Middle East and strategic competition in the Indo-Pacific. The US dip was an accounting feature of reduced aid rather than a strategic choice, and the rest of the world kept rising. Europe's surge, the fastest among European NATO members since 1953 according to SIPRI, is the most significant structural change, because it is anchored to a long-term target rather than a single crisis.
For analysts, the key question for the next five years is not whether spending will rise but whether it will produce usable capability: ammunition lines, air defense, trained personnel and resilient supply chains. Money is an input, and its conversion into deterrence is uneven. We track how these budget decisions play out in active theaters through the RAGE INDEX, and our daily coverage of defense and geopolitics is available on RAGE Intel.
Sources#
- SIPRI, "Trends in World Military Expenditure, 2025" (Fact Sheet, April 2026): https://www.sipri.org/sites/default/files/2026-04/2604_milex_2025.pdf
- SIPRI, "Trends in World Military Expenditure, 2025" (publication page): https://www.sipri.org/publications/2026/sipri-fact-sheets/trends-world-military-expenditure-2025
- SIPRI, press release, "Global military spending rise continues as European and Asian expenditures surge" (27 April 2026): https://www.sipri.org/media/press-release/2026/global-military-spending-rise-continues-european-asian-expenditures-surge
- CSIS, "What Does NATO Defense Spending Look Like Heading into the Ankara Summit?" (July 2026): https://www.csis.org/analysis/what-does-nato-defense-spending-look-heading-ankara-summit
- NATO, "Funding NATO" and defense expenditure topic page: https://www.nato.int/cps/en/natohq/topics_49198.htm
- Defense News, "NATO says all allies to meet 2% defense spending target this year" (August 2025): https://defensenews.com/global/europe/2025/08/29/nato-says-all-allies-to-meet-2-defense-spending-target-this-year
- OSW Centre for Eastern Studies, "NATO summit in The Hague: Trump's return and a two-component 5% of GDP on defence" (June 2025): https://www.osw.waw.pl/en/publikacje/osw-commentary/2025-06-26/nato-summit-hague-trumps-return-and-a-two-component-5-gdp
- Axios, "What's inside Trump's $1.5 trillion Pentagon blueprint" (April 2026): https://www.axios.com/2026/04/08/pentagon-budget-request-2027-trump
- Breaking Defense, "Golden Dome, out years and lots of missiles: details of Trump's $1.5T defense budget request" (April 2026): https://breakingdefense.com/2026/04/golden-dome-out-years-and-lots-of-missiles-details-of-trumps-1-5t-defense-budget-request/
About RAGE X: RAGE X is a global media, intelligence and technology organization working across geopolitical intelligence, military and conflict analysis, OSINT, global news, security and software. Learn more at theragex.com.
Continue the assessment
Related Intelligence
The Global Arms Trade: Top Exporters, Importers and Shifting Alliances
The global arms trade in 2021–25: SIPRI data on top exporters and importers, Europe's import surge, Russia's decline and the shifting alliances behind it.
2026-10-21 · 13 min read
Russia's War Economy: How Long Can It Actually Last
Russia spent 65% of Q1 federal revenue on defence. The four-month deficit exceeded all of 2025. Growth forecast cut to 0.4%. The sustainability arithmetic.
2026-08-28 · 12 min read
The Russian Army Rebuilt: What Four Years of War Produced
Putin says 700,000 in Ukraine — the same as mid-2024. Contract signings fell 20% year-on-year. Russia adapted its doctrine and hit a recruitment wall.
2026-08-28 · 12 min read
Today's conflict risk
The daily RAGE INDEX scores global conflict risk across six theaters, with sources and forecasts.
Read the RAGE INDEXReach readers like these
RAGE X sells sponsored content across RAGE Intel, RAGE War and RAGE Global by proposal, always labelled as sponsored.
Request a campaign proposal