The Global Arms Trade: Top Exporters, Importers and Shifting Alliances
RAGE Global · Guide · Updated 2026-10-21 · 13 min read
The global arms trade is one of the clearest indicators of how states read the threats around them and whom they trust to help meet those threats. The latest data from the Stockholm International Peace Research Institute (SIPRI), published in March 2026 and covering 2021–25, show a market that is growing, concentrating around the United States and pivoting decisively toward Europe. Russia's position as an exporter has collapsed, Ukraine has become the world's largest importer, and the old pattern of the Middle East and Asia absorbing most of the world's weapons has shifted.
Key takeaways
- The volume of international transfers of major arms in 2021–25 was 9.2% higher than in 2016–20, the largest increase since 2011–15, according to SIPRI.
- The United States accounted for 42% of global arms exports, more than four times the share of second-placed France (9.8%).
- Russia's share of exports fell from 21% to 6.8%, a 64% drop in volume; it was the only top-10 exporter whose exports fell.
- Europe took 33% of global imports, the largest regional share for the first time since the 1960s, with Ukraine (9.7%) and Poland (3.6%) among the top importers.
- SIPRI measures volume with its trend-indicator value (TIV), which tracks deliveries of weapons, not the financial value of contracts.
How the global arms trade is measured#
Any serious discussion of the global arms trade has to start with how it is counted, because the most widely cited dataset does not measure money. SIPRI's Arms Transfers Database records deliveries of major conventional weapons between states, and between states and non-state actors, and expresses them in a common unit called the trend-indicator value. The TIV is designed to capture the military resources being transferred rather than the price paid for them. That distinction explains why SIPRI rankings sometimes differ from headline figures about multi-billion-dollar contracts that may take a decade to deliver.
What the trend-indicator value captures#
According to SIPRI's published methodology, the TIV is based on the known unit production costs of a core set of weapons. Systems whose production cost is not known are valued by comparison with those core weapons, using characteristics such as size, performance, electronics, engine, armament and year of production. Second-hand weapons already in service with another armed force are valued at 40% of a new equivalent, and used weapons that have been significantly refurbished or modified before delivery are valued at 66%. The annual volume for any transfer is the TIV per system multiplied by the number of systems delivered in that year.

Chart: How SIPRI calculates the trend-indicator value. Source: SIPRI Arms Transfers Database, Sources and Methods (accessed 2026).
What is included and what is left out#
SIPRI's definition of "major arms" covers aircraft over 500 kg (and drones over 150 kg), air defense systems, armored vehicles, artillery of 100 mm calibre or more, engines, missiles and guided bombs, ships over 100 tonnes, sensors such as fire-control radars, and reconnaissance satellites. It excludes small arms and light weapons other than portable guided missiles, trucks, artillery below 100 mm, ammunition, most components, support services and technology transfers. That exclusion matters for the war in Ukraine, where much of the materiel supplied has been artillery shells and other ammunition that the TIV does not count. Because deliveries are lumpy, a single frigate or a batch of fighter jets can swing a country's annual figure, so SIPRI compares five-year periods. SIPRI also cautions that TIV figures are not sales prices and should not be compared directly with GDP, military budgets or export licence values.
The big picture: 2021–25 at a glance#
SIPRI's March 2026 fact sheet, Trends in International Arms Transfers, 2025, found that the volume of international transfers of major arms in 2021–25 was 9.2% higher than in 2016–20. That is the biggest increase between consecutive five-year periods since 2011–15. The rise reflects three overlapping drivers: the full-scale Russian invasion of Ukraine in February 2022, the subsequent rearmament of European states, and continued high demand in parts of the Middle East and Asia.
The geography of demand has changed more than the total. Europe received 33% of global imports in 2021–25, a 210% increase on the previous period, making it the largest importing region for the first time since the 1960s. Asia and Oceania, which had been the leading region for years, took 31% (down 20%), and the Middle East took 26% (down 13%). The Americas accounted for 5.6% and Africa for 4.3%, the latter after a 41% fall.
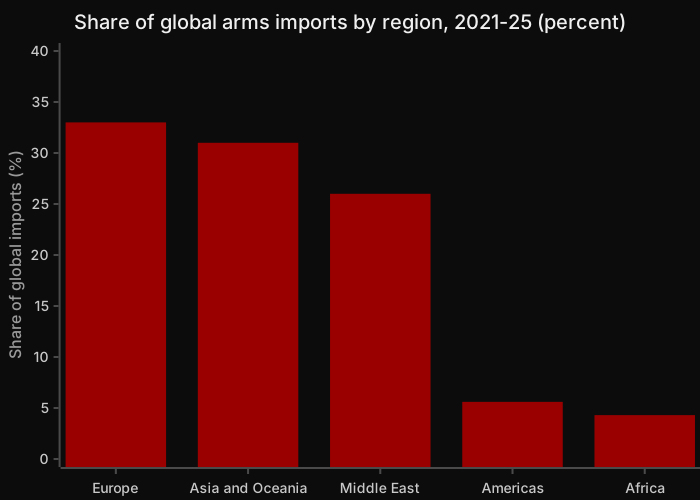
Chart: Regional shares of global imports of major arms, 2021–25. Source: SIPRI Fact Sheet, March 2026.
On the supply side, the market has become more concentrated. The United States alone supplied 42% of all major arms, and the top five exporters together (the United States, France, Russia, Germany and China) accounted for roughly 70%. The main change below the top spot is the rise of mid-sized suppliers such as Italy, Israel and South Korea, which have taken market share as Russia's exports have shrunk.
The top 10 arms exporters#
The table below lists the ten largest exporters of major arms in 2021–25, their global share, the change in their export volume compared with 2016–20, and their three largest customers. It is the most compact summary available of who arms whom in the current global arms trade.
| Rank | Exporter | Global share 2021–25 | Change vs 2016–20 | Main recipients (share of exporter's deliveries) |
|---|---|---|---|---|
| 1 | United States | 42% | +27% | Saudi Arabia 12%, Ukraine 9.4%, Japan 8.9% |
| 2 | France | 9.8% | +21% | India 24%, Egypt 11%, Greece 10% |
| 3 | Russia | 6.8% | −64% | India 48%, China 13%, Belarus 13% |
| 4 | Germany | 5.7% | +15% | Ukraine 24%, Egypt 14%, Israel 10% |
| 5 | China | 5.6% | +11% | Pakistan 61%, Serbia 6.8%, Thailand 4.7% |
| 6 | Italy | 5.1% | +157% | Qatar 26%, Kuwait 17%, Indonesia 12% |
| 7 | Israel | 4.4% | +56% | India 29%, Germany 21%, United States 7.8% |
| 8 | United Kingdom | 3.4% | +13% | Qatar 31%, United States 14%, Ukraine 13% |
| 9 | South Korea | 3.0% | +24% | Poland 58%, Philippines 18%, UAE 9.5% |
| 10 | Spain | 2.3% | +6.7% | Saudi Arabia 28%, Türkiye 16%, Belgium 12% |
Source: SIPRI, Trends in International Arms Transfers, 2025 (March 2026).
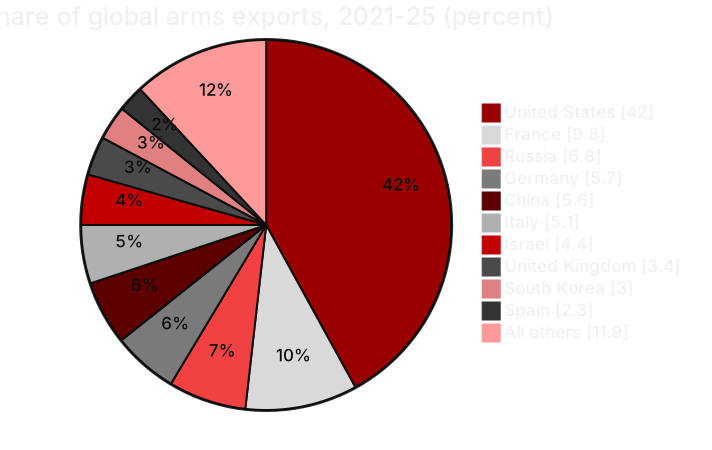
Chart: Global arms export shares of the top 10 suppliers, 2021–25. Source: SIPRI Fact Sheet, March 2026.
The United States: a widening lead#
US arms exports grew by 27% between 2016–20 and 2021–25, lifting its global share to 42%. According to SIPRI, Europe received 38% of US arms exports in 2021–25, the first time in two decades that Europe, rather than the Middle East, was the largest destination; the Middle East's share fell from 45% to 33%. The United States was among the top three suppliers to 76 states. Combat aircraft such as the F-35, air and missile defense systems such as Patriot, and large volumes of aid to Ukraine underpin these numbers. The trend gives Washington significant leverage, because operators of US systems depend on American spare parts, software updates and training for decades after delivery.
France: the consolidated number two#
France's exports rose 21%, keeping it in second place with 9.8% of the global total and deliveries to 63 states. Asia and Oceania took 31% of French exports, the Middle East 28% and Europe 21%. India was by far the largest customer, taking 24%, reflecting Rafale combat aircraft and submarine programmes, followed by Egypt and Greece. France has positioned itself as an alternative supplier for states that want advanced Western equipment with fewer political conditions than are sometimes attached to US sales, and it has been a vocal proponent of European defense industrial autonomy.
Russia: from second place to a distant third#
The most dramatic movement in the global arms trade has been the decline of Russia. Its share of global exports fell from 21% in 2016–20 to 6.8% in 2021–25, and the volume of its exports fell by 64%. SIPRI identifies it as the only top-10 supplier whose exports decreased. The war in Ukraine has absorbed Russian production, Western sanctions have constrained access to components, and US pressure on third countries has deterred some buyers. Of the remaining Russian exports, 76% went to Asia and Oceania, with India (48%), China (13%) and Belarus (13%) the main recipients. Even India, Russia's most important long-term customer, has steadily diversified: SIPRI notes that Russia's share of Indian imports fell from 70% in 2011–15 to 40% in 2021–25.
The rising mid-tier: Italy, Israel and South Korea#
Italy's exports grew by 157%, the largest increase among the top ten, driven largely by naval and aircraft deliveries to Gulf states; the Middle East took 59% of Italian exports. Israel's exports rose 56%, with India and Germany its largest customers, the latter reflecting European interest in Israeli air and missile defense technology. South Korea's growth of 24% was concentrated in a single relationship: Poland took 58% of South Korean arms exports, including tanks, self-propelled howitzers and light combat aircraft ordered after 2022. China, in fifth place, remains heavily dependent on one client, with Pakistan taking 61% of its arms exports.
The top 10 arms importers#
The import side of the global arms trade shows where military demand is most acute. The 2021–25 ranking is headed by a country at war, followed by large regional powers that rely on foreign suppliers for advanced systems.
| Rank | Importer | Global share 2021–25 | Change vs 2016–20 | Main supplier (share of imports) |
|---|---|---|---|---|
| 1 | Ukraine | 9.7% | +11,896% | United States 41% |
| 2 | India | 8.2% | −4.0% | Russia 40% |
| 3 | Saudi Arabia | 6.8% | −31% | United States 77% |
| 4 | Qatar | 6.4% | +106% | United States 48% |
| 5 | Pakistan | 4.2% | +66% | China 80% |
| 6 | Japan | 3.9% | +76% | United States 95% |
| 7 | Poland | 3.6% | +852% | South Korea 47% |
| 8 | United States | 2.9% | +48% | United Kingdom 17% |
| 9 | Kuwait | 2.8% | +805% | United States 62% |
| 10 | Australia | 2.8% | −39% | United States 85% |
Source: SIPRI, Trends in International Arms Transfers, 2025 (March 2026).
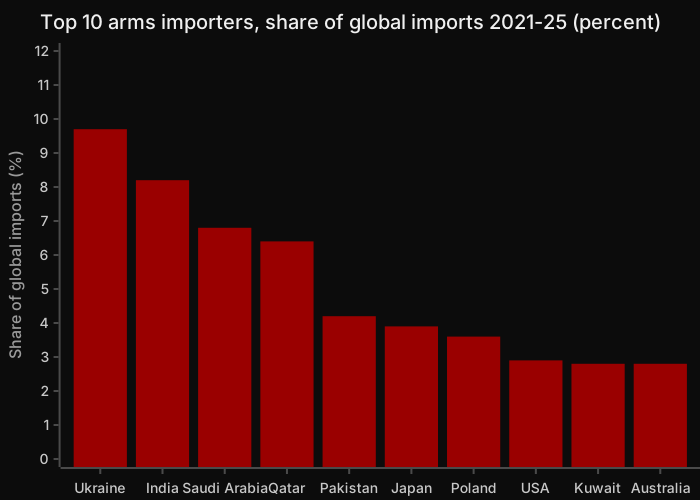
Chart: The ten largest importers of major arms, 2021–25. Source: SIPRI Fact Sheet, March 2026.
Seven of the ten largest importers rely on the United States as their main supplier. The exceptions are India, which still sources most heavily from Russia; Pakistan, which depends on China for 80% of its imports; and Poland, whose leading supplier is now South Korea. The presence of the United States itself in eighth place, with the United Kingdom as its largest supplier, reflects the deep integration of the transatlantic defense industrial base rather than any dependence on foreign weapons.
Europe's import surge and the Ukraine effect#
Europe is the defining story of the global arms trade in the 2020s. SIPRI's figures show that the combined arms imports of the 29 European NATO member states grew by 143% between 2016–20 and 2021–25. The United States supplied 58% of those imports, and the volume coming from the United States rose by 142%. Poland took 17% of European NATO imports, the United Kingdom 10% and the Netherlands 9.0%. After the United States, the main suppliers to European NATO members were South Korea (8.6%), Israel (7.7%) and France (7.4%).
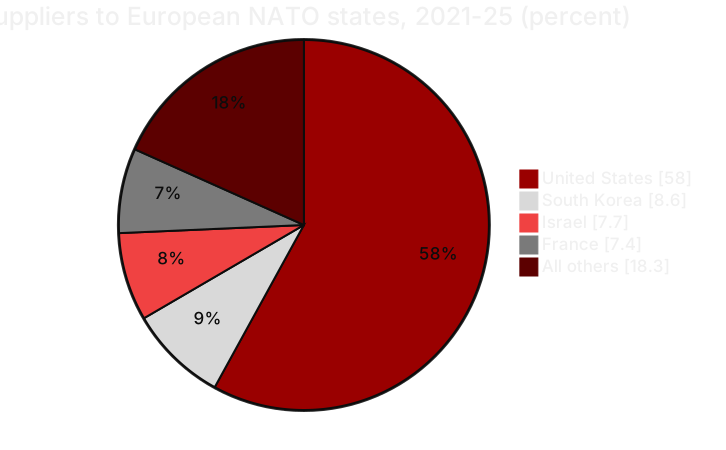
Chart: Main suppliers of major arms to the 29 European NATO states, 2021–25. Source: SIPRI Fact Sheet, March 2026.
Ukraine: from marginal buyer to largest importer#
Ukraine accounted for just 0.1% of global imports in 2016–20. In 2021–25 it accounted for 9.7%, making it the largest importer in the world. SIPRI reports that at least 36 states have supplied major arms to Ukraine since the Russian invasion of 2022, with the United States (41%), Germany (14%) and Poland (9.4%) the largest sources. Much of this has been delivered as military aid from existing stocks rather than through commercial sales. SIPRI also notes that transfers to Ukraine in 2025 were substantially lower than in 2023 or 2024, largely because US military aid was reduced. Since ammunition is excluded from the TIV, these figures understate the full scale of external support.
Why Europe is buying abroad#
European states have committed to large increases in defense spending, but their own industries have struggled to scale up quickly after decades of low orders. That gap has pushed governments toward suppliers able to deliver at speed, notably the United States for aircraft and air defense, and South Korea for armored vehicles and artillery. The pattern creates a tension within European policy. Leaders in Paris and Brussels have argued for buying European to build strategic autonomy, while frontline states such as Poland and the Baltic states have prioritized delivery time and interoperability with US forces. The SIPRI data suggest that, for now, urgency is winning over industrial policy.
The Middle East: still central, less dominant#
The Middle East remains one of the most important markets in the global arms trade, accounting for 26% of global imports in 2021–25, but its share fell as overall imports to the region declined by 13%. The United States supplied 54% of the region's imports, followed by Italy (12%), France (11%) and Germany (7.3%).
Gulf buyers#
Saudi Arabia was the world's third-largest importer with 6.8% of global imports, though its volume fell 31% compared with the previous period; 77% of Saudi imports came from the United States. Qatar's imports more than doubled (+106%), giving it 6.4% of the global total, with significant deliveries from the United States, Italy and the United Kingdom. Kuwait's imports rose by 805%, placing it ninth globally. Because Gulf states often place very large orders that are delivered over several years, their rankings can move sharply between periods without any change in underlying strategy.
Israel and the wider region#
Israel was the 14th-largest importer, with 1.9% of global imports, up 12%. According to SIPRI, 68% of its imports came from the United States and 31% from Germany. Israel is also now the world's seventh-largest exporter, which illustrates how the global arms trade is increasingly a two-way exchange among technologically advanced partners. Arms transfers to the region, especially to parties involved in the Gaza conflict and the confrontations involving Iran, have been the subject of intense political and legal debate in supplier countries, with governments, parliaments and courts in several states reviewing export licences.
Asia and Oceania: rivalry without a single buyer#
Asia and Oceania received 31% of global imports in 2021–25, a 20% fall from 2016–20, partly because China and some other large buyers now produce more of their own weapons. The region is defined by several overlapping rivalries: China and the United States with its allies, India and Pakistan, and the Korean peninsula.
South Asia#
India was the second-largest importer in the world with 8.2% of global imports, down 4.0%. Russia supplied 40%, France 29% and Israel 15%, according to SIPRI. India's long shift away from Russian equipment, combined with its push for domestic production, is one of the slowest-moving but most consequential trends in the market. Pakistan's imports rose 66%, to 4.2% of the global total, and 80% came from China, cementing one of the most exclusive supplier relationships anywhere.
East Asia and the Pacific#
Japan's imports grew by 76%, giving it 3.9% of global imports, with 95% sourced from the United States as Tokyo invests in long-range strike and air defense. Australia's imports fell 39% but it remained the tenth-largest importer, with 85% from the United States. China's imports fell by 72%, leaving it in 21st place with 1.3% of the global total, a reflection of Beijing's growing self-sufficiency; Russia supplied 66% of what China did import. Taiwan's imports rose 54% to 0.8% of the global total, with 96% from the United States. Many announced US sales to Taiwan are still awaiting delivery, so its share may rise in future periods.
What the data say about shifting alliances#
Arms transfers are rarely only commercial. A major weapons purchase typically ties the buyer to the seller for 30 years or more through training, maintenance, munitions and upgrades. Reading the global arms trade therefore offers a view of how alignments are forming beneath official rhetoric.
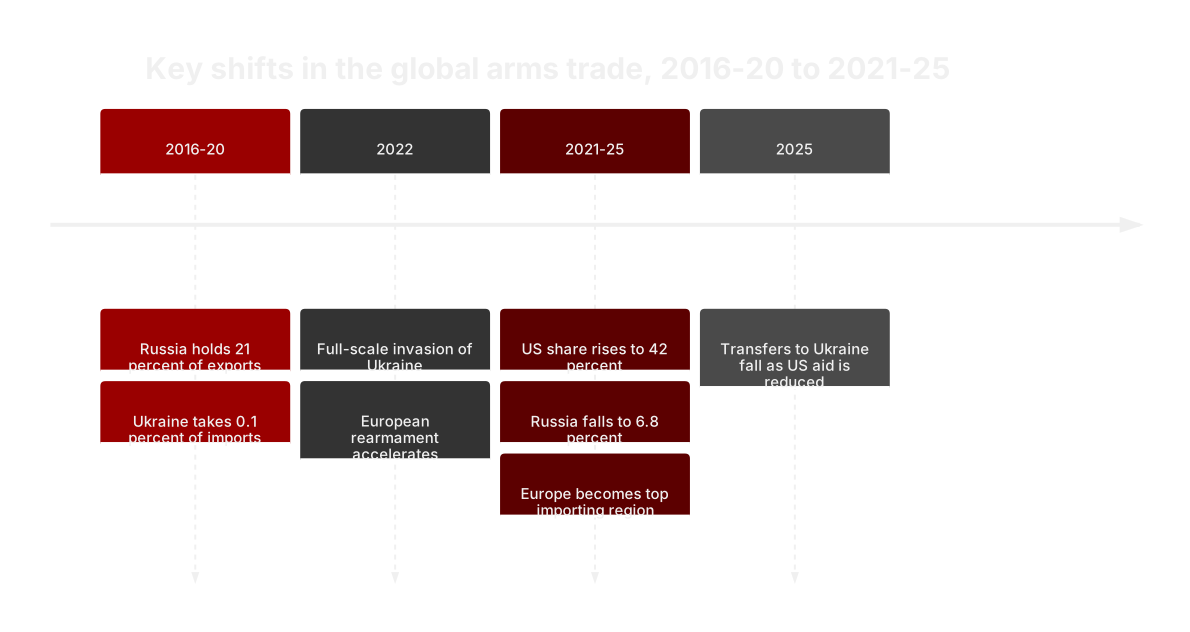
Chart: Timeline of structural changes in arms transfers. Source: SIPRI Fact Sheet, March 2026.
Consolidation around the United States#
The clearest pattern is consolidation around Washington. Europe, the Gulf, Japan, Australia and Taiwan are all more dependent on US systems than five years ago. For allies this brings interoperability and access to the most advanced platforms; it also means exposure to shifts in US policy, as the reduction in US deliveries to Ukraine in 2025 demonstrated. The debate in Europe over whether to prioritize speed of delivery or domestic industry is, at its core, a debate about how much of that exposure is acceptable.
Russia's partners and the diversifiers#
Russia's customer base has narrowed to a small group of states, chiefly India, China and Belarus, along with smaller buyers in Asia and Africa. Its relationship with North Korea and Iran, which according to Western governments have supplied munitions and drones to Russia, does not appear in the export data in the same way, but signals a shift toward transactional partnerships among sanctioned states. Meanwhile, a group of diversifying buyers, India, Egypt, Indonesia and several Gulf states among them, spreads purchases across France, Italy, Israel, South Korea, Türkiye and others to avoid dependence on a single patron. That hedging behavior is one of the reasons mid-tier exporters are growing.
What to watch next#
Several indicators will shape the next SIPRI release. The first is whether European industry can capture a larger share of European orders as production lines expand. The second is the trajectory of US deliveries to Ukraine and whether European states fill the gap. The third is whether China's exports, still concentrated on Pakistan, broaden to new markets. Finally, analysts will watch whether Russia can rebuild any export capacity if fighting in Ukraine eases. For continuous monitoring of the conflicts driving this demand, the RAGE INDEX global conflict intelligence dashboard tracks the theaters where these weapons are deployed.
Frequently asked questions#
Who is the largest arms exporter in the world?#
The United States is the world's largest arms exporter by a wide margin. According to SIPRI's March 2026 fact sheet, it accounted for 42% of global exports of major arms in 2021–25, with export volumes rising 27% compared with 2016–20. France was second with 9.8% and Russia third with 6.8%. The US lead rests on combat aircraft, air and missile defense systems, and large deliveries to Europe, the Middle East and Asia. It was among the top three suppliers to 76 countries, giving it unmatched influence over allied military capabilities.
Who is the largest arms importer?#
Ukraine was the largest importer of major arms in 2021–25, with 9.7% of the global total according to SIPRI, compared with just 0.1% in 2016–20. Most of these weapons were supplied as military aid following Russia's full-scale invasion in 2022, with the United States, Germany and Poland the largest suppliers. India was second with 8.2%, followed by Saudi Arabia (6.8%), Qatar (6.4%) and Pakistan (4.2%). Because SIPRI excludes ammunition, the data understate the total volume of support to Ukraine.
How big is the global arms trade?#
SIPRI does not express its arms transfer data in dollars. It uses the trend-indicator value, a common unit based on production costs that measures the military resources transferred rather than prices paid. What SIPRI does report is the trend: the volume of transfers in 2021–25 was 9.2% higher than in 2016–20. Financial estimates of the arms trade, drawn from national export reports, exist but are incomplete because many states do not publish data. For year-to-year comparisons, the TIV is the most consistent measure available.
Why have Russian arms exports fallen so sharply?#
Russia's arms exports fell 64% between 2016–20 and 2021–25, cutting its global share from 21% to 6.8%. Analysts point to several causes. The war in Ukraine has absorbed Russian industrial output for its own forces. Western sanctions have restricted access to components and payment channels. The United States has pressured customers to avoid new Russian deals. Long-standing buyers such as India have also been diversifying toward France, Israel and domestic production. Russia now relies on a narrow group of customers, led by India, China and Belarus.
Why is Europe importing so many weapons?#
Europe's imports rose 210% in 2021–25 compared with 2016–20, making it the largest importing region for the first time since the 1960s. The main drivers are Russia's invasion of Ukraine, direct military aid to Kyiv, and a sharp rise in defense spending among NATO members bordering Russia. European industry could not expand quickly enough, so governments turned to suppliers with available production capacity, particularly the United States, which supplied 58% of European NATO imports, and South Korea, which became Poland's leading supplier.
What is SIPRI's trend-indicator value?#
The trend-indicator value (TIV) is SIPRI's unit for measuring the volume of arms transfers. It is based on the known unit production costs of a core set of weapons; other systems are valued by comparing their characteristics with those core weapons. Used equipment is valued at 40% of a new item, or 66% if significantly refurbished. The TIV is multiplied by the number of systems delivered. It reflects actual deliveries, not contracts, and SIPRI says it should not be compared directly with GDP or financial sales figures.
The RAGE X view#
The 2021–25 data describe a global arms trade being reshaped by war rather than by markets. The concentration of supply around the United States, the collapse of Russian exports and the emergence of Europe as the largest importing region are structural shifts that will outlast any single conflict, because weapons bought today define logistics, training and alliance ties for decades. The rise of South Korea, Israel and Italy shows that buyers are rewarding suppliers that can deliver quickly, and the heavy dependence of many allies on US systems makes American policy choices a central variable for their security planning.
For analysts, the lesson is to read transfers as long-term commitments rather than one-off transactions. A Polish tank order, a Qatari frigate or a Pakistani fighter purchase signals strategic alignment as clearly as any treaty. RAGE X will continue to track these flows alongside the conflicts that drive them through the RAGE INDEX, with daily reporting on defense and security developments on RAGE Intel. More on our work is available at theragex.com.
Sources#
- SIPRI, "Trends in International Arms Transfers, 2025," Fact Sheet, March 2026: https://www.sipri.org/publications/2026/sipri-fact-sheets/trends-international-arms-transfers-2025
- SIPRI, Fact Sheet PDF, March 2026: https://www.sipri.org/sites/default/files/2026-03/fs_2603_at_2025.pdf
- SIPRI Arms Transfers Database, Sources and Methods: https://sipri.org/databases/armstransfers/sources-and-methods
- SIPRI, "Trends in International Arms Transfers, 2024," Fact Sheet, March 2025: https://www.sipri.org/sites/default/files/2025-03/fs_2503_at_2024.pdf
- SIPRI, "Trends in World Military Expenditure, 2025," Fact Sheet, April 2026: https://www.sipri.org/sites/default/files/2026-04/2604_milex_2025.pdf
- World Bank, Arms imports (SIPRI trend indicator values) metadata: https://databank.worldbank.org/metadataglossary/world-development-indicators/series/MS.MIL.MPRT.KD
About RAGE X: RAGE X is a global media, intelligence and technology organization delivering geopolitical intelligence, military and conflict analysis, OSINT and security insight. Learn more at theragex.com.
Continue the assessment
Related Intelligence
Global Military Spending 2026: Who Spends the Most and Why
Global military spending hit $2,887 billion in 2025, per SIPRI. See the top 15 spenders, regional trends, share of GDP, NATO's 5% target and the outlook.
2026-10-21 · 15 min read
Russia's War Economy: How Long Can It Actually Last
Russia spent 65% of Q1 federal revenue on defence. The four-month deficit exceeded all of 2025. Growth forecast cut to 0.4%. The sustainability arithmetic.
2026-08-28 · 12 min read
The Russian Army Rebuilt: What Four Years of War Produced
Putin says 700,000 in Ukraine — the same as mid-2024. Contract signings fell 20% year-on-year. Russia adapted its doctrine and hit a recruitment wall.
2026-08-28 · 12 min read
Today's conflict risk
The daily RAGE INDEX scores global conflict risk across six theaters, with sources and forecasts.
Read the RAGE INDEXReach readers like these
RAGE X sells sponsored content across RAGE Intel, RAGE War and RAGE Global by proposal, always labelled as sponsored.
Request a campaign proposal