How Military Power Is Measured: Beyond Troop Numbers, Budgets and League Tables
RAGE Global · Guide · Updated 2026-10-21 · 13 min read
Every year a new military power ranking circulates widely online, telling readers which country has the "strongest military in the world." These lists are popular because they reduce a complex question to a single number, but the methods behind them vary enormously, and the answer depends on what is being counted and why. This guide compares the main approaches used by analysts, from the data-driven inventories of the International Institute for Strategic Studies (IISS) to composite indexes such as Global Firepower and the Lowy Institute's Asia Power Index, and the scenario-based modelling pioneered by RAND.
Key takeaways
- No single number can capture military power; it depends on the scenario, the adversary, the geography and the time frame.
- Data sources such as the IISS Military Balance and SIPRI's spending and nuclear databases count inputs; composite indexes then weight those inputs, often in ways that are not fully transparent.
- The 2026 Global Firepower ranking places the United States, Russia and China at the top, but does not count nuclear arsenals directly and has been criticized for privileging quantity.
- Troop numbers are a poor proxy: China fields about 2 million active personnel according to IISS, yet personnel size says little about training, logistics or readiness.
- Scenario-based assessments, such as RAND's U.S.-China Military Scorecard, show that the "balance" changes with distance from home territory and the type of operation.
Why measuring military power is hard#
Military power is the ability to use, or credibly threaten to use, organized force to achieve political objectives. That definition already exposes the problem with any military power ranking: power is relational and situational. A navy built to defend coastal waters may be highly effective at home and almost irrelevant 3,000 kilometres away. An army optimized for counterinsurgency may struggle in high-intensity conventional war. Power is also about the will to use force, the quality of political and military leadership, and the willingness of allies to help, none of which can be counted in a spreadsheet.
Capabilities versus outcomes#
Analysts commonly distinguish between military capabilities, the resources a state possesses, and military effectiveness, the ability to convert those resources into battlefield outcomes. History offers many examples of states that looked stronger on paper and performed worse in practice. Russia's difficulties in the first months of its full-scale invasion of Ukraine in 2022, against an opponent that many pre-war tables ranked far below it, became a frequently cited case of the gap between inventory and performance. The reverse is also true: smaller forces with good training, intelligence and cohesion regularly outperform their numbers.
The data problem#
Even the inputs are uncertain. Many governments do not publish complete figures on personnel, equipment holdings or defense budgets, and some publish figures that are deliberately incomplete. Researchers therefore rely on open sources, official statements, satellite imagery and expert judgment, and different organizations arrive at different estimates. Any credible military power ranking should state its sources, its year and its uncertainty; many popular lists do none of these.
The building blocks of military power#
Before comparing methods, it helps to define the components that most serious assessments consider. Different models weigh them differently, and some omit several entirely.
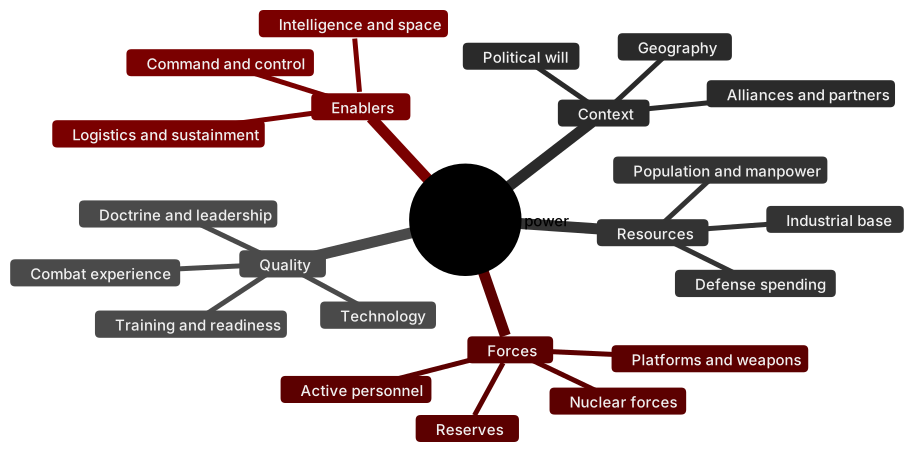
Chart: Core components of military power used across major assessment frameworks. Source: RAGE X synthesis of IISS, Lowy Institute, RAND and Global Firepower methodologies, 2026.
Spending, manpower and platforms#
Spending is the most widely available indicator and the most common starting point. It reflects what a state can afford to buy, maintain and train, though purchasing power, salaries and procurement efficiency vary widely between countries. Manpower, measured as active personnel and reserves, matters for occupying territory and sustaining long wars. Platforms, such as combat aircraft, warships, submarines, tanks and artillery, are the most visible component, and they are what most rankings count. The difficulty is that a 1970s tank and a modern main battle tank may be counted as equal units.
Logistics, readiness and the industrial base#
Logistics determines whether forces can be moved, fuelled, armed and repaired far from home. Readiness measures the share of forces that can actually deploy and fight on short notice, which depends on maintenance, spare parts and training hours. The industrial base, the ability to produce munitions, vehicles and replacement systems, has regained attention since the war in Ukraine exposed how quickly modern combat consumes artillery shells and air defense interceptors. A state with large inventories but limited production capacity may be strong on day one and weak by month six.
Nuclear forces, alliances and combat experience#
Nuclear weapons sit apart from conventional power. They deter attack on core interests but are of limited use for most military tasks. According to the SIPRI Yearbook 2026, the world's nine nuclear-armed states held an estimated 12,187 warheads in January 2026, of which around 4,012 were deployed, and Russia and the United States together held about 83% of usable stockpiles. Alliances can multiply a state's power, as NATO's collective defense commitment does for its smaller members. Combat experience can improve doctrine and adaptation, but it can also reflect attrition and exhaustion rather than strength.
Counting the inputs: IISS and SIPRI data#
The most authoritative open-source inventories come from two institutions. The IISS publishes The Military Balance annually, providing country-by-country data on personnel, equipment and defense budgets. SIPRI publishes databases on military expenditure, arms transfers and nuclear forces. Neither produces a military power ranking; they provide the raw material that others use.
The IISS Military Balance#
The 2026 edition of The Military Balance, launched on 24 February 2026 and the 67th in the series, estimated global defense spending at $2.63 trillion in 2025, an increase of 2.5% year on year, according to reporting on the launch by Forces News. Europe's share of global defense spending rose to 21%, from 17% in 2022. The publication's strength is detail: it lists units, equipment types and quantities for nearly every country with armed forces, allowing analysts to see what a force is actually composed of rather than a single headline number.
The table below shows the ten largest armed forces by active personnel according to the 2026 edition, as reported by Business Insider in March 2026. Figures are rounded and represent IISS estimates, not official establishment strength.
| Rank | Country | Active personnel (IISS, 2026 edition) |
|---|---|---|
| 1 | China | 2,035,000 |
| 2 | India | 1,501,000 |
| 3 | United States | 1,340,000 |
| 4 | North Korea | 1,280,000 |
| 5 | Russia | 1,264,000 |
| 6 | Ukraine | 677,000 |
| 7 | Pakistan | 660,000 |
| 8 | Iran | 610,000 |
| 9 | Ethiopia | 503,000 |
| 10 | South Korea | 450,000 |
Source: IISS, The Military Balance 2026, as reported by Business Insider (9 March 2026).
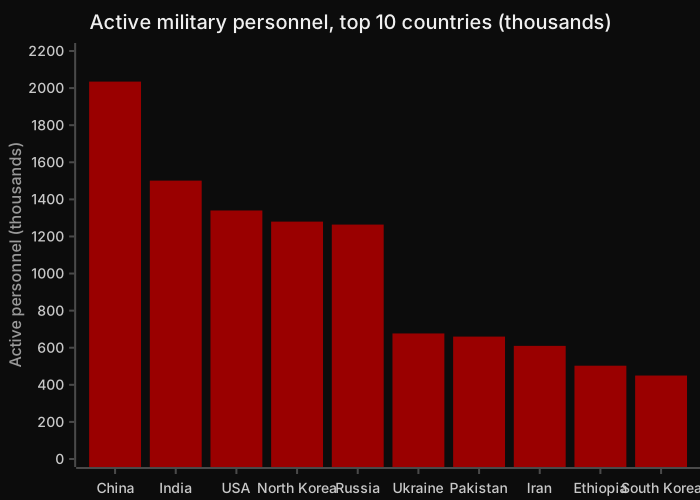
Chart: Active military personnel of the ten largest armed forces. Source: IISS, The Military Balance 2026, via Business Insider, March 2026.
The list itself illustrates the limits of headcount. North Korea fields roughly as many active personnel as the United States, but with far older equipment, limited fuel and very little ability to project force beyond the Korean peninsula. Ethiopia and Iran appear in the top ten, while the United Kingdom, France and Japan, which rank highly in most capability assessments, do not.
SIPRI military expenditure#
SIPRI's April 2026 fact sheet found that world military expenditure rose 2.9% in real terms in 2025, to $2,887 billion, the eleventh consecutive year of growth. Its figures differ from the IISS total because the two institutes use different definitions of what counts as military spending and different methods for estimating opaque budgets.
| Rank | Country | Spending 2025 (US$ bn) | Share of world | Share of GDP |
|---|---|---|---|---|
| 1 | United States | 954 | 33% | 3.1% |
| 2 | China* | 336 | 12% | 1.7% |
| 3 | Russia* | 190 | 6.6% | 7.5% |
| 4 | Germany | 114 | 3.9% | 2.3% |
| 5 | India | 92.1 | 3.2% | 2.3% |
| 6 | United Kingdom | 89.0 | 3.1% | 2.4% |
| 7 | Ukraine* | 84.1 | 2.9% | 40% |
| 8 | Saudi Arabia* | 83.2 | 2.9% | 6.5% |
| 9 | France | 68.0 | 2.4% | 2.0% |
| 10 | Japan | 62.2 | 2.2% | 1.4% |
Source: SIPRI, Trends in World Military Expenditure, 2025 (April 2026). Asterisk denotes SIPRI estimate.
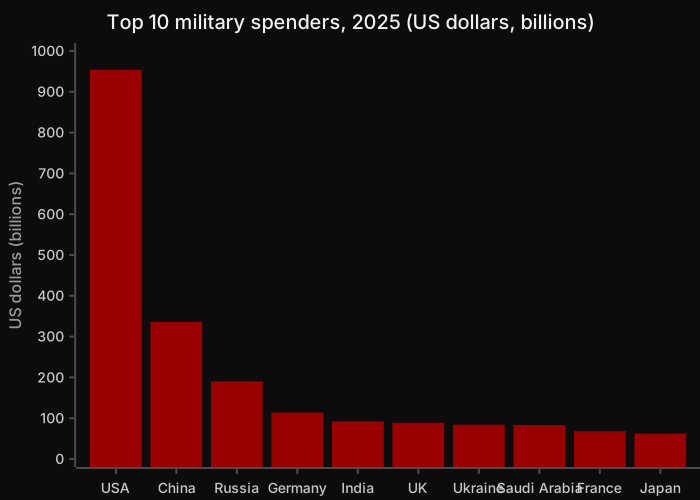
Chart: The ten largest military spenders in 2025. Source: SIPRI Fact Sheet, April 2026.
Spending figures at market exchange rates tend to understate the purchasing power of countries with lower labor and production costs, such as China, Russia and India. A dollar spent on a soldier's salary or a domestically built armored vehicle in those countries buys more than in the United States or Western Europe. This is one reason why comparisons based purely on budgets can exaggerate the gap between the United States and its competitors.
Composite indexes: Global Firepower and its critics#
Global Firepower (GFP) is the most widely shared military power ranking on the internet. Its 2026 edition assesses 145 countries using more than 60 individual factors, including the quantity of military units, financial standing, logistics capability and geography. These are combined into a single "PwrIndx" score, where a lower number indicates greater conventional fighting capability and 0.0000 is a theoretical perfect score.
| Rank | Country | PwrIndx score (2026) |
|---|---|---|
| 1 | United States | 0.0741 |
| 2 | Russia | 0.0791 |
| 3 | China | 0.0919 |
| 4 | India | 0.1346 |
| 5 | South Korea | 0.1642 |
| 6 | France | 0.1798 |
| 7 | Japan | 0.1876 |
| 8 | United Kingdom | 0.1881 |
| 9 | Türkiye | 0.1975 |
| 10 | Italy | 0.2211 |
Source: Global Firepower, 2026 Military Strength Ranking (lower score indicates greater strength).
How the index is built#
GFP has stated in past editions that its ranking focuses on weapon diversity rather than total numbers alone, that nuclear stockpiles are not counted directly but recognized or suspected nuclear powers receive a bonus, that NATO members receive a slight bonus to reflect shared resources, and that landlocked states are not penalized for lacking a navy. It also says current political and military leadership is not taken into account. Geography, natural resources, available manpower, industry and financial health all feed into the score.
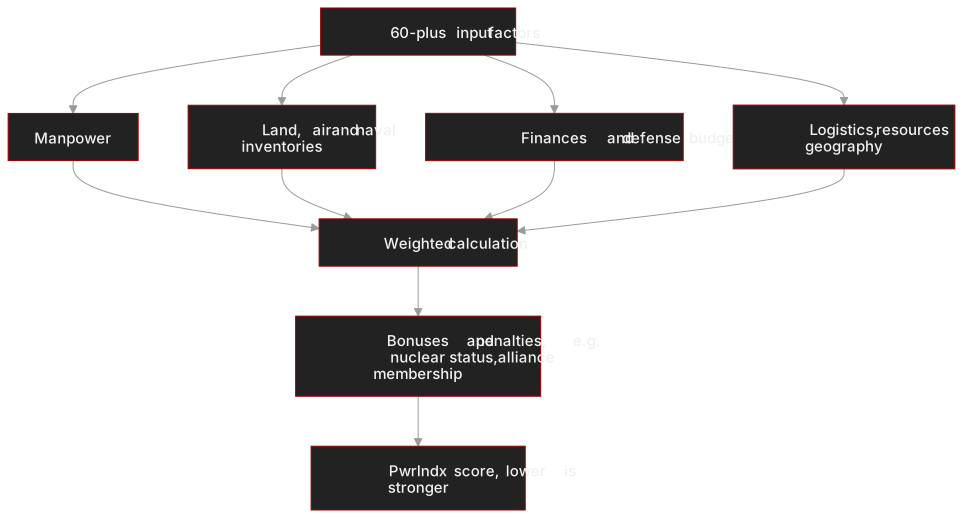
Chart: Simplified structure of the Global Firepower PwrIndx. Source: Global Firepower methodology notes, 2018 and 2026 editions.
The main criticisms#
Analysts and academics have raised several recurring objections. First, the weighting is not fully published, so users cannot reproduce or test the score. Second, the index relies heavily on counts of platforms, which rewards large inventories of ageing equipment; Russia's second-place ranking in 2026, after more than four years of heavy equipment losses in Ukraine documented by open-source analysts, illustrates the tension. Third, it gives limited weight to the qualities that decide wars, including training, readiness, logistics in practice, intelligence, command and control, and morale. Fourth, it scores countries in isolation, although power is always relative to a particular rival in a particular place. Finally, the treatment of nuclear weapons as a bonus rather than a separate dimension blurs the distinction between deterrence and warfighting.
None of this makes the index useless. It is a transparent enough list of inventories to start a discussion, and it is updated annually. The problem arises when its rank order is read as a prediction of who would win a war.
Regional power models: the Lowy Asia Power Index#
The Lowy Institute's Asia Power Index takes a different approach. Rather than ranking military strength alone, it measures comprehensive power across 27 countries and territories in the Indo-Pacific, using 131 indicators grouped into eight measures: economic capability, military capability, resilience, future resources, economic relationships, defense networks, diplomatic influence and cultural influence. Military capability itself is a weighted average of five sub-measures, defense spending, armed forces, weapons and platforms, signature capabilities and Asian military posture, built from 22 indicators.
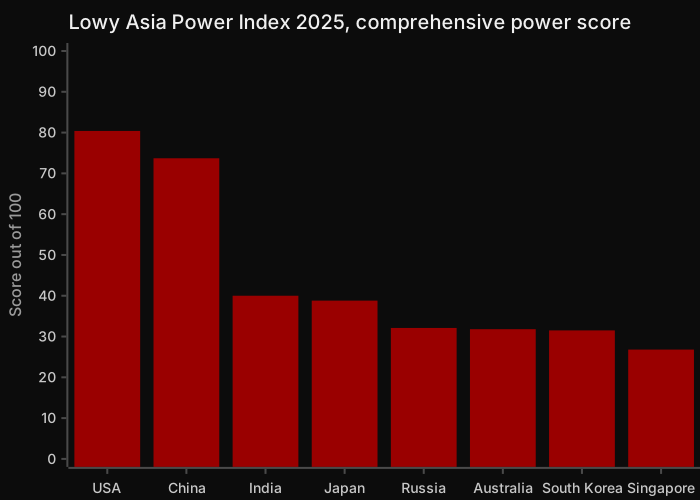
Chart: Top eight countries in the Lowy Institute Asia Power Index. Source: Lowy Institute, Asia Power Index 2025 Key Findings.
What the Lowy model adds#
The 2025 edition found that the United States remains the leading power in Asia, but with its lowest score in the history of the index, while China narrowed the overall gap to its smallest margin since 2020. On military capability alone, the United States scored 88.9 and China 70.6. Lowy reports that the US lead on this measure is now about two-thirds of what it was in 2017, and that China has led the United States on military posture in Asia since 2024. Two features make this model more informative than a global league table. It separates defense networks, where the United States scored 81.4, from raw capability, recognizing that alliances are a distinct source of power. And it includes regional posture, acknowledging that proximity matters as much as size.
Scenario analysis: the RAND approach#
RAND, the US research organization, has long argued that military power should be measured against specific missions. Its 2015 study The U.S.-China Military Scorecard: Forces, Geography, and the Evolving Balance of Power, 1996–2017 assessed ten operational areas in two scenarios: a conflict over Taiwan, roughly 160 kilometres from the Chinese coast, and a campaign around the Spratly Islands, roughly 940 kilometres away.
What the Scorecard showed#
The ten scorecards covered areas including Chinese missile attacks on air bases, air superiority, US penetration of Chinese airspace, anti-surface warfare, counterspace operations, cyber warfare and strategic nuclear stability. The central finding, as summarized by Defense News at publication, was that the balance depended heavily on geography. Closer to China, Chinese capabilities had narrowed or in some areas overturned US advantages; farther away, in the Spratly scenario, the United States retained a clearer edge. The study projected that US regional dominance would continue to erode over the following 5 to 15 years if trends held.
Why the method matters#
Scenario analysis asks the question that league tables avoid: strong at doing what, against whom, and where? It forces analysts to consider basing, logistics, missile ranges, sensor coverage and the time available to reinforce. RAND's earlier work on national power, Measuring National Power in the Postindustrial Age (2000), made a similar argument at a broader level, contending that power depends on how states convert economic, technological and social resources into effective military capability. The weakness of this approach is cost and scope: detailed scenario modelling requires significant expertise and cannot easily be applied to 145 countries at once.
Why military power rankings mislead#
Taken together, these approaches suggest five reasons to treat any single military power ranking with caution.
Quantity is not quality#
Counting tanks, aircraft or soldiers treats unlike things as equal. Readiness rates, maintenance standards, training hours and the age of equipment vary widely, and most of these are not published. A smaller, well-trained and well-supplied force can defeat a larger one, and conflicts since 2022 have repeatedly shown that inexpensive systems, such as drones, can alter the value of expensive platforms.
Context decides outcomes#
Power is always exercised somewhere, against someone. Geography, distance, terrain, weather and the presence of allies shape outcomes as much as inventories do. This is why the RAND and Lowy approaches, which build in geography and posture, often produce different conclusions from global indexes.
Sustainment and industry are underweighted#
Modern war consumes munitions at rates that peacetime planners underestimated. The capacity to produce shells, missiles and replacement vehicles, and to finance that production, has become a decisive factor in the war in Ukraine. Most rankings capture inventories at a single moment rather than the ability to replace them.
Data are incomplete and dated#
Rankings are only as good as their inputs, and many governments limit disclosure. A table published in early 2026 may reflect data from 2024 or 2025. Readers should check which edition and year a figure comes from, as this article has tried to do throughout.
Intangibles cannot be scored#
Leadership, morale, cohesion, political will and the legitimacy of a cause have decided many wars, and none of them can be reliably quantified. Analysts who rely on numbers alone risk repeating errors that preceded several recent conflicts, where pre-war assessments of relative strength proved wrong. Monitoring how forces actually perform in active theaters, as the RAGE INDEX does for ongoing conflicts, is a necessary complement to static data.
Frequently asked questions#
Which country has the strongest military in the world?#
Most assessments place the United States first. It has the largest defense budget, $954 billion in 2025 according to SIPRI, unmatched global logistics, and the most extensive alliance network. The 2026 Global Firepower index also ranks it first, followed by Russia and China. The Lowy Institute's 2025 Asia Power Index gives the United States a military capability score of 88.9 against China's 70.6. However, "strongest" depends on context: closer to China's coast, studies such as RAND's Scorecard suggest the balance is much narrower.
Which country has the largest army by number of troops?#
China has the largest active armed forces, with about 2,035,000 personnel according to the IISS Military Balance 2026, as reported by Business Insider. India is second with about 1.5 million, followed by the United States, North Korea and Russia, each with roughly 1.26 to 1.34 million. These figures count active personnel only and exclude reserves and paramilitary forces, which can be very large in some countries. Troop numbers alone do not indicate fighting capability, because training, equipment and logistics vary widely.
Is the Global Firepower ranking reliable?#
Global Firepower is useful as a quick, annually updated overview of military inventories across 145 countries, but it should not be read as a prediction of battlefield outcomes. Its exact weighting is not published, it relies heavily on counts of equipment, and it gives limited weight to training, readiness, logistics in practice and leadership. Nuclear weapons are treated as a bonus rather than measured directly. Analysts generally use it as a starting point and rely on IISS data and scenario-based studies for serious assessment.
How do analysts measure military power?#
Serious analysts combine several methods. They start with data on spending, personnel and equipment from sources such as the IISS Military Balance and SIPRI. They then consider qualitative factors such as training, readiness, doctrine and combat experience. Composite indexes, like the Lowy Asia Power Index, weight many indicators together. Scenario-based modelling, as used by RAND, tests how forces would perform in specific operations and locations. The most credible conclusions usually come from comparing the results of several approaches.
Do nuclear weapons count in military power rankings?#
It depends on the ranking. Global Firepower does not count nuclear stockpiles directly but has said recognized nuclear powers receive a bonus. The Lowy Institute folds strategic capabilities into a "signature capabilities" sub-measure of military capability rather than ranking arsenals on their own. Many analysts treat nuclear forces as a separate dimension because they deter attack on vital interests but are not usable for most military tasks. According to SIPRI, nine states held an estimated 12,187 nuclear warheads in January 2026, with Russia and the United States holding about 83% of usable stockpiles.
Why do different military power rankings disagree?#
Rankings disagree because they measure different things, use different data and apply different weights. Some count equipment, others measure spending, and others assess comprehensive national power including economic and diplomatic influence. Data on personnel and budgets vary between sources such as IISS and SIPRI because of definitions and estimation methods. Regional models include geography and posture, which global tables ignore. Disagreement is therefore expected and is itself informative about which factors drive a given result.
The RAGE X view#
The appetite for a single military power ranking is understandable, but the evidence from the past several years argues for humility. Inventories and budgets are necessary starting points, and the IISS and SIPRI datasets remain the most credible foundations for them. Yet the factors that have proved decisive in recent wars, including industrial capacity, munitions supply, readiness, adaptation and the reliability of partners, are those that league tables measure least well. A responsible assessment asks a specific question, against a specific adversary, in a specific place, and draws on several methods before reaching a conclusion.
For RAGE X, measuring military power is an exercise in context, not arithmetic. Our country profiles and conflict analysis on RAGE Intel combine published data with observed performance, and the RAGE INDEX tracks how these forces behave in active theaters. More on our approach is available at theragex.com.
Sources#
- IISS, The Military Balance 2026: https://www.iiss.org/publications/the-military-balance/
- Business Insider via AOL, "The 25 largest militaries in the world, ranked by the number of active troops" (9 March 2026): https://www.aol.com/articles/25-largest-militaries-world-ranked-132301908.html
- Forces News, "Rising tensions drive global defence spending to record $2.63 trillion" (24 February 2026): https://www.forcesnews.com/news/rising-tensions-drive-global-defence-spending-record-263-trillion
- SIPRI, "Trends in World Military Expenditure, 2025," Fact Sheet, April 2026: https://www.sipri.org/sites/default/files/2026-04/2604_milex_2025.pdf
- SIPRI, SIPRI Yearbook 2026 nuclear forces press release (June 2026): https://www.sipri.org/node/7895
- Global Firepower, 2026 Military Strength Ranking: https://www.globalfirepower.com/countries-listing.php
- Lowy Institute, Asia Power Index 2025 Key Findings Report: https://power.lowyinstitute.org/downloads/lowy-institute-2025-asia-power-index-key-findings-report.pdf
- Lowy Institute, Asia Power Index, Military Capability: https://power.lowyinstitute.org/explore/military-capability/
- Lowy Institute, "Asia Power Index: United States weakens, China and India rise amid shifting regional dynamics": https://www.lowyinstitute.org/newsroom/asia-power-index-united-states-weakens-china-india-rise-amid-shifting-regional-dynamics
- Heginbotham et al., The U.S.-China Military Scorecard, RAND (2015), summary via MIT Security Studies Program: https://ssp.mit.edu/publications/2015/the-u-s-china-military-scorecard
- Defense News, "Analysis: RAND Says US Facing Tough Fight With China" (18 September 2015): https://www.defensenews.com/home/2015/09/18/analysis-rand-says-us-facing-tough-fight-with-china/
- Tellis et al., Measuring National Power in the Postindustrial Age, RAND (2000): https://www.rand.org/content/dam/rand/pubs/monograph_reports/MR1110/RAND_MR1110.pdf
About RAGE X: RAGE X is a global media, intelligence and technology organization delivering geopolitical intelligence, military and conflict analysis, OSINT and security insight. Learn more at theragex.com.
Continue the assessment
Related Intelligence
The Ukraine Front Line in 2026: Where the War Actually Stands
Russian forces have not taken Pokrovsk. Ukraine advanced at Kupyansk. Infiltration replaced assault. What the front actually looks like in 2026.
2026-09-02 · 12 min read
Global Military Spending 2026: Who Spends the Most and Why
Global military spending hit $2,887 billion in 2025, per SIPRI. See the top 15 spenders, regional trends, share of GDP, NATO's 5% target and the outlook.
2026-10-21 · 15 min read
How Geopolitical Risk Is Measured: Indices, Methods and Early-Warning Signals
How is geopolitical risk measured? A guide to the GPR index, ACLED, UCDP, the Global Peace Index, the Fragile States Index and early-warning signals.
2026-10-21 · 16 min read
Today's conflict risk
The daily RAGE INDEX scores global conflict risk across six theaters, with sources and forecasts.
Read the RAGE INDEXReach readers like these
RAGE X sells sponsored content across RAGE Intel, RAGE War and RAGE Global by proposal, always labelled as sponsored.
Request a campaign proposal